How High Can VXX Go?
VXX skew pretty much blew up in August. The highest strike trading right now is 180 in Jan-2012 options (it is 45 in the pre-split strikes, not on the regular chain) at 136% implied volatility. Delta risk in these options is very very small: for example during 2008 crisis SPVXSTR index rose from low of 53010 to 231276, a 336% increase. Extrapolating to todays VXX, assuming that we repeat 2008 VXX could rise from low of 20.11 (in the beginning on July) to a maximum of 87.74. Obviously we're nowhere near these levels, and my model tells me that the odds are that we'll never reach these levels. On the other hand during 2008 it took almost 3 months from minimum to maximum ( from low in Aug 2008 to high in November 2008 ). Extrapolating the dates we could see VXX peak at the end of September. The chart below superimposes current VXX trajectory (red) on the adjusted SPVXSTR levels from 2008 (blue) . X-axis in trading days.
XVZ ETF From iPath
Last week iPath debuted a S&P 500 Dynamic VIX ETN trading with ticker XVZ (press release, info sheet, prospectus) When I first saw the chart of XVZ backtest I had a sense of déjà vu - XVZ looks a lot like VOLT ETN that Nomura launched in Europe few months ago (bloomberg ticker VOLT:LN) However while XVZ strategy is based on the slope of implied volatility VOLT is based on volatility of volatility. The index that XVZ is tracking is SPDVIXTR index, construction of which is explained on page 21 of the prospectus. XVZ dynamically allocates to short-term futures, long or short depending on the ratio of VIX to VXV, the rest is allocated to a long position in mid-term futures. One can see that in the backtest the index rose sharply during 2008 financial crisis, but held its value relatively well during the subsequent volatility decline that decimated VXX.
EDIT: Read more about XVZ on Six Figure Investing blog.
Week in Volatility
World markets continued decline sending volatility indexes higher. VIX rose another 6.69 points which VSTOXX Index had 2.46 point gain since last week. Long-term VIX futures trade at around 30, historically a very high level, showing that elevated volatility is going to stay with us for sometime. Meanwhile Jared Woodard provided an excellent analysis on VIX futures on his blog.
Implied volatilities of VIX and VSTOXX options rose only slightly, which just may be a product of time to expiration. VSTOXX ATM term structure seems relatively flat to the VIX, with Sep and Nov below VIX ATMs, and Jan-12 above VIX ATMs.
VIX Publications
I created a new page that lists and links all noteworthy volatility-related publications. Most of them have already been reviewed on the blog, but I thought this would be a convenient reference for the readers.
VIX Expiration
After a few months of quite markets August expiration cycle brought extreme volatility. VRO - VIX expiration value rose by 13.63 points to 32.73, and VSTOXX closed today at 35.04 up 7.39 from last month. Even though my forecasts from month ago were correct on direction, they were significantly off since I could not anticipate the magnitude of spike in both indexes. For the September expiration (Sep-21-2011) my forecasts are:
VIX to close at 29.65 vs market's forecast of 27.80 in the futures
VSTOXX to close at 34.16 vs market's forecast of 32.05 in the futures
For complete transparency all my forecasts are archived on forecasts tracker page.
VIX to close at 29.65 vs market's forecast of 27.80 in the futures
VSTOXX to close at 34.16 vs market's forecast of 32.05 in the futures
For complete transparency all my forecasts are archived on forecasts tracker page.
Week in Volatility
This week saw a lot of market action, but not much directional movement. Volatility indexes and futures rose. There is a huge spike in in implied volatility of VSTOXX options, but given that they have only 3 trading days until expiration it does not mean much. Implied volatility of VIX options was almost unchanged since last week. I think the next week we will see more of the same with a lot of volatility going into options expiration.
Particularly striking was the move in RTSVX, which closed on Tuesday at 71.64 finishing the week at 53.63, up over 20 points since the week before. Increased volatility in the market boosted trading volumes in RTSVX contracts to new record levels.
At the same time CBOE SKEW index - measure of market-implied assymetry did not change much. As I mentioned before which VIX measures total volatility of the market, it is possible to separate upside and downside volatility. According to my calculations market expectation of upside volatility for the next 30 days is 28.23%, and downside volatility 43.57% (both are annualized) . For weekly horizon these translate to 3.9% and 6%.
Visualizing Recent Volatility Spike
I took inspiration from recent VIX and more post to create a different visualization of recent volatility spike. This is a dot chart that demonstrates volatility changes in the past month. Size and color of the dots corresponds to volatility (bigger and redder = high vol, smaller and greener = low vol), or you can hover over for numerical values. The left-most column corresponds to the VIX index, which is the most volatile, and underwent the most drastic change from high to low. Other columns correspond to futures, and are more stable, especially backs months. The chart was created using graphael library. If you don't see the chart, please try a different browser.
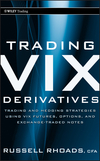
Trading VIX Derivatives by Russell Rhoads
I just finished reading Trading VIX Derivatives: Trading and Hedging Strategies Using VIX Futures, Options, and Exchange Traded Notes by Russell Rhoads. The book belongs in the trading office because of its detailed coverage of US volatility derivatives such as VIX futures and options, and volatility ETFs and ETNs.
There are two main themes / parts in the book. The first one reviews fundamental concepts of implied volatility, volatility index calculation, and contract specifications for volatility products. All topics are covered thoroughly including weekly VIX options, and binary options on the VIX, and volatility strategy indexes. There is a lot of information, and while most of it is available on CBOE website and various prospectuses the book provides a good summary.
The second theme in the book is about practical trading aspects of VIX derivatives trading. Chapter 9 starts off with discussions of various hedging strategies, concluding with the summary of U of Massachusetts study on superiority hedging performance of VIX derivatives during the 2008 financial crisis. I think it would have been nice to include a somewhat counter position in The Hazards of Volatility Diversification but I don't think the second paper was available at the time of writing. Mr Rhoads covers different spreads strategies with VIX futures and options, starting with calendar spreads. Trading calendar spreads in the VIX is very difficult because of non-linear relationship between different VIX futures contracts. Instead of mathematical model the author focuses on examples of profitable and non-profitable spreads, how they tend to work on average and during the time of crisis. The idea is to give the reader some common-sense wisdom about behavior of calendar spreads, intuition about when they can be traded profitably, and potential risks. The last topic covered in the book is on vertical spreads which are not that different from other options. The author covers basic spread strategies like Condors and Flies and how they trade in VIX options.
Overall I think it is a high-quality book, but let me clarify one thing about the intended audience. If you're completely new to options this is definitely not the book for you. If you are a highly experienced VIX trader, then you probably already know most of the material in the book, but may enjoy it as a review. If you're experienced (non-VIX) options trader and want to learn more about volatility derivatives and how they are different from other equity options then Trading VIX Derivatives is a great non-quantitative book that will provide you with all the information you need.
Week in Volatility
Global markets were rocked by sharp index declines and increased volatility. SPX declined 7% and STOXX was down 11% since from last friday. Yesterday VIX has reached an intraday high of almost 40, a level not seen since flash crash aftermath over 12 months ago. Since last week VIX rose 6.75 points, VSTOXX rose 11.62, and RTSVX by 10.23.
Implied volatility of VIX options also has spiked to tremendous levels. Please note that the normal shape of VIX ATM IVs is to decline with maturity because of mean-reverting property. Implied volatility in VSTOXX options also rose, but not as much as VIX. I don't think there are any opportunities in VSTOXX trading because I calculate implied volatility from settlement prices, and bid ask spreads are significant.
Subscribe to:
Posts (Atom)
Weekly market report
Wall st delivered a mixed bag of news with VIX, VNKY, and VSTOXX and their underlying markets almost unchanged. VXD - volatility index based...
-
As I am sure all of you know Russia has began a full scale war against my home country Ukraine. Please make no mistake - Putin's goal ...
-
Many investors are looking at VIX and VSTOXX indexes as a leading indicators of volatility in equity markets, however many are confused by t...
-
Wall st delivered a mixed bag of news with VIX, VNKY, and VSTOXX and their underlying markets almost unchanged. VXD - volatility index based...