Quick Analysis of Market-Implied Election Day Volatility

This is a quick note on market vol implied by SPX options for this year’s U.S. presidential election on Nov 8. Calculating implied event vol, for example for stock options over quarterly earnings announcement day, is commonplace and trivial, but in this election, for the very first time we have an opportunity to analyze the event with unprecedented granularity.

Before 2016, options expirations were available just once per week, typically on Fridays. This year CBOE launched SPX options expiring on Mondays and Wednesdays, allowing us to calculate implied volatility over the 48 hours from the close of Monday, Nov 7 to close on Wednesday, Nov 9. Since voting will take place on Tuesday, Nov 8, the results will probably be tallied to statistical certainty by the close of trading on Wednesday, barring the like of 2000 election debacle.
Looking at options data I calculated table below.

ContractFromUntil (Expiration)Implied Move
SPX.XO10/31/201611/2/20161.20%
SPX.XO11/2/201611/4/20161.16%
SPX.XO11/4/201611/7/20160.85%
SPX.XO11/7/201611/9/20162.17%
SPX.XO11/9/201611/11/20161.22%
SPX.XO11/11/201611/14/20160.79%
SPX.XO11/14/201611/16/20161.08%
SPXPM.XO11/16/201611/18/20161.10%
SPX.XO11/18/201611/21/20160.72%
SPX.XO11/21/201611/23/20160.93%
SPX.XO11/23/201611/25/20160.45%
SPX.XO11/25/201611/28/20161.09%
SPX.XO11/28/201611/30/20161.12%

As expected, the 48-hour period over election day shows the highest implied forward vol of 2.17%, about twice what we would expect for non-election trading period. Alternatively, we can say that market expects about 1.31% election event vol, and “regular” volatility of 0.79% per day. I realize that it is annualized vol of just 12.72%, which is much smaller than VXST but my number is the average through the end of November and by construction excludes election vol .

Also, today (at the time of writing) markets are higher, and vol indexes are higher - this is not surprise as VIX will rise into the election simply on "closer jump" effect.

SAR Volatility Arbitrage Is Having A Great Year

Numbers for September are in and SAR Volatility Arbitrage fund (from Zurich-based Systematic Absolute Return AG) is having a fantastic +8.13% return for September, bringing their YTD return to +36.34%. Firm's website describes the strategy as follows.
SAR Volatility Strategies (“VOLS”) are SAR’s newly developed, model-based and fully automated short-term systems, trading S&P 500 Index volatility. SAR VOLS combines long and short volatility momentum and volatility arbitrage strategies within balanced portfolios to provide protection against volatility spikes and market sell-offs, plus steady returns. 
Somewhat slim on details, I assume they trade mostly VIX futures or VXX. Congratulations, guys!

VXX contango vs Theta decay

Reader Mike sent me a question:
We know that the underlying value of VXX decreases daily, mainly by contango. Also, Put options written against the VXX decrease in value each day by theta decay. However, Put options rise in price when their underlying asset decreases in value. Thus, if volatility were held constant, would the contango of the VXX (which decreases the VXX value, thus increases a written put option value) override the theta decay incurred by that same written put option.

I ask this question in an attempt to determine if writing out of the money Puts against the VXX several months from expiration is a losing proposition given volatility is a constant.
My answer:
Excellent question! Unfortunately, most interesting questions do not have a straightforward answer, so I will try to give you two perspectives on this. First perspective is from the theory, on how financial assets behave, and what we can expect in a market without frictions. Then I will try to show what we know empirically. Human language, at least casual conversation, sometime is very imprecise in description of probabilistic concepts. That is why you read statements like "VXX goes down" or "leveraged ETFs go down" or "long options lose money". This stems either from not understanding or not expressing properly all properties of expected future outcomes. 
Financial assets are usually bounded at zero and positively skewed (like on the chart above) and typical, most common, median outcome is lower than the expected, average, mean outcome. For leveraged ETFs I explained it on my blog, but even better here For VIX futures, or VXX things work the same way - most likely scenario is that your long position will decline in value, but every once in  a while the index will spike up and your position will produce a much larger gain. On average in an efficient market you will be breaking even, as a result of frequent small losses and few large wins. Same for buying options - few large wins, many small losses, beak-even on average; expected P/L = 0.  
Contango in VXX does not make you money if you short VXX, it is just a property of the distribution. Selling options does not make you money, it is just the most likely scenario. I am not saying that there are no strategies that you could pursue to identify if an option (or any other financial instrument) is over or underpriced, and try to profit from some strategy, it is that just any particular act by itself, such as "short VXX" or "short option" or "long stocks" or any other "strategy" like  "buy|short [financial instrument]" will on average only break even. Such strategy may however be positively skewed, or negatively skewed. So in theory, writing VXX puts is expected to break even - unless you have some strategy to identify overpriced VXX puts and sell those, but you did not specify an such method in your email. It is that just intrinsically (just by virtue of their existence) these puts (or any other puts) are not overpriced - some very smart people are on the other side of your trade, and they dislike losing money as much as you do.
Now, to the practical part -  when we talk about writing puts on VXX you have two factors opposing each other - VXX most likely to decline in price, bringing you put farther into the money, and short put is most likely to decline in value as well. Let me add few more factors - increase in VXX volatility is more likely to be correlated with
increase in VXX level, so will work in favor of your put sale. On the other hand VXX indeed declines (slightly) on average due to trading frictions,  commissions,  ETF fees, etc. So to understand the NET effect of these disparate factors you will have to crunch some data. When I get around to doing that, I will write something on my blog.

9/11 Bill Veto and Market Volatility

I just left a panel discussion event organized by Sigma Analysis and Management and wanted to share one thing with the readers. The star of the panel was Nancy Davis of Quadratic Capital, a veteran volatility manager. She was head above other panelists on volatility trading, and provided no fluff technical answers - a rare thing for discussion panels.

When asked on upcoming events Ms Davis suggested the following potential catalyst: recently passed hot-button issue of 9/11 bill that strips sovereign immunity off Saudi Arabia and would allow victims of terrorism to sue the country. President Obama promised to veto the bill, which he must do within  ten days. The bill was passed 9 days ago, and the deadline is tomorrow, the 23rd. Congress also is poised to override the veto.

While on the surface it is a mostly political event, it can have very serious financial consequences. Saudi Arabia, through various investment vehicles is a major! investor in US equities, debt, hedge funds, real estate, etc. If the president does not veto the bill, or Congress overrides the veto we could see a significant selloff due to outflow of investment funds from US across assets, potentially a few forced liquidations, and it could also jeopardize Saudi Aramco IPO.

CME Adding ES Wednesday Weeklys

It was only a matter of time, and is no surprise to anyone. Link Given half-year delay I predict CME Monday weeklys Q1 2017.

In Case You Missed It - SPX Monday Weeklys


Somehow I missed the press-release or other news sources, but earlier this week CBOE listed Monday-expiring weekly options. Right now 3 expirations are listed: Monday August 22nd, 29th, and Tuesday September 6th.

Volume, open interest, and bid-ask spreads look reasonable for just-launched series, and I believe this product is already a success.

Now, with 3 regular expirations per week, it is only a question of time when CBOE will have options expiring every day of the week. The challenge is not in the product itself, but rather in technological barriers - market making software, increased network traffic, etc. I expect that we will not see another weekly expiration for another year.

I would also speculate that perhaps the next launch will be in the VIX series, maybe Friday PM settled VIX options?


Regulators Getting It Right: Belgium Bans Binary Options, Leveraged CFDs

Top Belgian securities regulator, the Financial Services and Markets Authority announced in a recent communique, that distribution of binary options, leveraged CFDs, and ultra-short (<1 hour) derivatives contracts. Apparently there is some question regarding the exact translation (link), and since I don't know french or dutch I cannot comment on that.

Everyone in the industry knows that binary options is a festering pool of fraud, and responsible for much of spam marketing on the internet. I applaud actions of FSMA, and hope that more regulators around the word will follow suit.

PUT vs WPUT Analysis

Earlier this year Oleg Bondarenko, professor at U of Illinois published an excellent empirical analysis of CBOE's PUT index and more recent WPUT (same as PUT but using weekly options). I will review some of the points in the paper comparing theoretical values with the ones that were empirically observed.

Here is a summary, and complete research paper.

Professor Bondarenko notes:
Selling 1-month ATM puts 12 times a year can produce significant income. From 2006 to 2015, the average monthly premium is 2.01%.
From 2006 to 2015, the average weekly premium is 0.75%.
Although smaller, the premium is collected more frequently. Intuitively, the premium of the ATM put increases as the square root of maturity. This means that a one-week tenor option rolled over four times per month will approximately generate 2.0x the premium of a one-month tenor option rolled over once per month (i.e., 1/2 premium times 4). 
Premium by itself, of course, does not guarantee profit. Let's take a look at some basic formulas (assuming ABM,  zero rates, and unit price for simplicity. All formulas were generated using Mathematica )


So, as stated, assuming 4 weeks per month, we would expect theoretically to collect 2x more premium. Since in reality we are collecting about 1.5x more premium, it means that weekly premiums are smaller than expected, which is pretty much what we would expect as vol term structure is in contango most of the time.

Similarly, expected vol arb (implied vs realized) PL suffers from contango.


In theory, for the same implied vol value we would expect 2x more profit for WPUT, while in practice WPUT has slightly underperformed PUT.
This implies an interesting relationship (not a statistical or theoretical, just merely an observation) if we simply re-arrange the terms, that value of weekly implied volatility is in between monthly implied volatility and realized volatility.

As an approximation I took VXST index (available since 2011), VIX, and SPX returns. Because of the period mismatch, the results are not exact - average value of VXST is 17.14, between  average of VIX of 17.47, and realized volatility of 15.54.

Now, let's consider another aspect of put selling - what is the risk? We can derive expected volatility of put selling strategy:


Just like in the formulas above, the expression is "per trade". That means that individual weekly trade will have half the volatility of monthly trade, but since there are 4 of them, and vol scales with the square root of # of trades, the expected volatility of PUT and WPUT should be the same. In reality, WPUT has somewhat smaller standard deviation (2.84% vs 3.32% ). Since expected volatility of put selling strategy only (theoretically) depends on realized volatility, the difference is quite surprising.

Finally we can derive a formula for sharpe ratio for selling ATM options, it is


We can see that sharpe ratio does not depend on frequency of put sales, but rather proportional to the percent difference in implied vs realized volatility. As expected, SR for WPUT is lower than that of the PUT.


Travelling

I am travelling to Ukraine to visit family. If you are a Kyiv-based volatility trader and would like to chat, send me an email.

Speaking of, Ukraine has a tiny options market (here's front month options on the UX index futures) Open interest at the time of writing is 15K contracts.

Making Money In Volatility Is Difficult

Well - making money in anything is difficult, but volatility is both difficult and complex. I received an interesting performance table for a number of  volatility and options funds (Nelson Report from Soc Gen, cannot post here for legal reasons) .

Total of 48 funds across 38 managers with average fund being about 6 years old. Out of 48 42 have positive average returns, 18 have sharpe over 1, and only 5 have sharpe over 2. These 5 are

  • Structured Alpha 1000 from Allianz 
  • Bond VOL from Global Sigma, as well as their 
  • Global Sigma Plus program
  • Mint Tower
  • Twin Tree

I am not familiar with the last two names, if you have any interesting information please get in touch.

P.S. A reader emailed me: "In your latest post your mention a report from Soc Gen.  I have access to their markets portal, but can't find any recent report authored by or related to a Nelson or anything volatility.  I'm very curious to look closer though.  Can you help with any other identifiers of said report?"   My reply: "I don't have access to the research portal and received it from a colleague. Maybe this will help - it was not a pdf report, but a spreadsheet called SG Nelson Report (May 2016) . Inside the spreadsheet it is called "Newedge Nelson Report".

SEC Charges Karen "The Supertrader" Bruton With Fraud

The filing is available here, but the summary is as follows:
Ms Bruton is a self-taught options trader who allegedly earned millions in profit with fraud. She gave a number of interviews that are available on youtube, and apparently is a known name for retain options traders.

SEC alleges that she would realize gains and roll over losses, but charge fees on realized gains. What I don't understand is how is this possible using listed options (she was in the business since 2008, why didn't she go bust? was it  incoming funds that kept her afloat?) and mark to market accounting? Didn't any of the clients ask to see actual account statements from their broker?

Global Sigma Interview

Short interview with Hanming Rao, founder of Global Sigma Group, one of the more successful volatility programs.

Since its inception in 2009, Global Sigma Plus Program realized 14% annual returns, with shape of 2.5+. More recently they started AGSF program in 2013, with similar returns, with sharpe of 1.6, and BondVOL program that started just a year ago.

Dr Rao highlights risks and opportunities in short-term options, and his approach to trading, where he tries to predict both short-term movement and volatility. I want to add that in my opinion systematic trading of weekly options is not for amateurs. Gamma risks are very significant, and even highly experienced trader like Dr Rao stumbled last year on volatility spikes.


FTSE 100 Weekly Options

LSE is launching weekly options on FTSE 100 index at the end of this month - May 31st. This brings the number of ex-US indexes with weekly options to 9.


Complete list:
1 SXE5 (Eurostoxx)
2 CAC
3 DAX
4 FTSEMIB
5 AEX
6 OMX
7 Nikkei
8 TWSE (Taiwan)
9 FTSE 100

H/t to Amsterdam Trader, excellent blog that covers news and developments in derivatives.

Russian Volatility Index

Moscow Exchange (after merger with RTS) has updated the methodology behind the benchmark index of Russian volatility. The new index is called RVI (RVI$ Index on Bloomberg) and is calculated using the same methodology as the VIX. Differences between the old and new index are explained on the exchange pages.

Index main. Methodology.

Sadly, there is no liquidity in the futures. I checked just a minute ago - only June expiration listed, volume 1 contract, open interest 2 contracts. May contract expired with open interest of only 136 contracts.

The index provides an interesting view of country-specific volatility during a time of a major warfare. The index' average level is about 30, about the same as the previous RTSVX index.

After Pro-Russian military forces seized control of Ukrainian Crimean peninsula, RVI did not react in a significant way. However the index spiked early in March 2014, probably after G8 members suspended preparations for the Sochi Summit. It seems that the market anticipated sanctions; but after spiking to 50s, index discounted the impact on economy and fell to 30s.

The currency market led the reaction to US and EU led sanctions on Russian attack on eastern Ukraine. In mid-december RVI spiked up again, to almost 100, mostly due to decline of Ruble, and actions of the Russian central bank.

At the time of writing is seems that even despite the war, despite all the sanctions, despite the decline in oil prices the index has stabilized at around 35 level - slightly elevated, but not a crisis level. RTSI Index is around multi-year lows, but after falling about 30% in December of 2014 has remained at around the same 800-900 level.

Thank you very much to reader Oleg P. who emailed me regarding the updated methodology.

International Indexes With Weekly Options

Right now there are few exchanges that offer weekly index options outside the US:

1 SXE5 (Eurostoxx)
2 CAC
3 DAX
4 FTSEMIB
5 AEX
6 OMX
7 Nikkei
8 TWSE (Taiwan)

Please email if I missed anything, or if there are any updates to this list.

Designing a Better Volatility Index

Few weeks ago BATS and T3 Index announced a launch of a new equity volatility index based on SPY options. You may have seen ridiculous click-bait titles like "VIX Faces Challenge From Trading Robots Unleashed by Bats." About half-year ago I had the pleasure of meeting with Simon Ho, CEO of T3 Index, and have been corresponding with him about technical details of the index. So in this post I will cut out the hype and bring you the inside scoop about the differences between two indexes.
BATS launched an index created by T3 Index; and while the index is not tradable at this time, the plan is obviously to launch derivatives on it to complete with CBOE's monopoly. A little more than a year ago BATS moved into FX trading with purchasing Hotspot FX from KCG, and they are eager to expand to volatility as well. As far as I know there is no BATS futures exchange at this time, so watch out for the relevant filing.

Now, the differences:

1 - The index is based on SPY options as opposed to SPX. This makes index more robust, in terms of exchange presence (if one of the options exchanges stops disseminating quotes) and competing for liquidity. While SPY minimum tick are two times wider (0.01 on 1/10th of the index, vs 0.05 on SPX) effective quoted spreads are often narrower. I hope to follow up with another post comparing liquidity in SPX vs SPY vs CME SPX options.

2 - Price "dragging". This is (as far as I know) a completely new idea in index construction. What it means is that referenced options price will not be updated just because mid-quote changes, rather it will only update on a trade, or when quote goes completely outside of previous reference price. It is kind of like calculating a median of reference price with most current quote. If the bid-ask are fluctuating wildly this significantly reduces spurious jitters in index values, since values are updated only when there is a significant move. I should also note that this makes calculation of index to be path-dependant, meaning that you cannot take a snapshot of SPY options quotes intraday and calculate index value; rather you will need intraday history since the opening.

3 - SPYIX is calculated from regular monthly options, not weekly options. Last August VIX calculation failed during the first half-hour of trading, and the failure was attributed to lack of liquidity in 4th and 5th weekly series. While CBOE cannot revert index construction back to series options without losing face, T3 can benefit from this experience, and choose greater robustness. Related issue that is worth mentioning is "extrapolation" in the serial (pre-weeklies) VIX. Basically there were certain times when 30 days would fall outside of serial expirations, and VIX value was extrapolated. To avoid this issue, i.e. to always interpolate SPYIX is rolled closer to expiration (at 2 full days, as opposed to one week for serial VIX, if I remember correctly)

4 - Higher truncation price. SPX options have a minimum tick of 0.05, and that was also a value for strike truncation rule - if two consecutive prices of less than 0.05 (no-bid) are counted, no further strikes are used. SPYIX is uses the same cutoff despite SPY being 10x smaller than SPX. This makes any potential index manipulation much more expensive - as only "expensive" significant quotes are used in index construction.

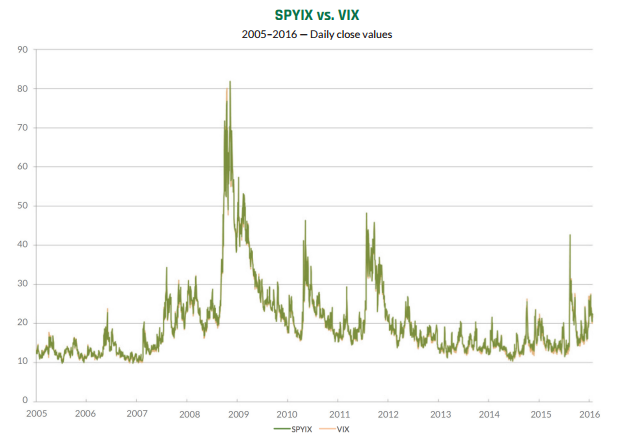
In fact robustness of the index is the main feature of SPYIX, and BATS explicity makes this point in the brochure "Reliability: The SPYIX is designed to withstand the most turbulent market conditions...when investors need it most." The rest of the time, both indexes values are in-line with each other - with SPYIX slightly above VIX ( mean 0.18, median 0.16, std 0.42)

Another technical difference, although that does not solve any robustness issues: SPYIX formula is the same as the VIX with only a small difference in how the forward adjustment is calculated. Basically both formulas have small adjustment terms, because we don't have a continuum of strikes, to account for when ATM forward is not exactly at a strike (which of course happens most of the time). VIX uses spot index value, and SPYIX uses interpolation with (another) robustness check. But meaning of the two formulas is essentially the same.

Another thing that I want to point out is a basis "difference". SPY pays quarterly dividend, and that has a small influence on index values. In theory before the ex-date SPYIX and VIX will diverge slightly, and will converge again right after the ex-date. In practice, this effect is not statistically significant (if you're interested in details, email me for exact numbers)

Additional resources:
SPYIX historical values, fact sheet, white paper, sample calculation.

CBOE Takes One Step Toward Exchange-Traded Exotics

CBOE announced yesterday, that in addition to "vanilla" FLEX options they will offer Asian and Cliquet options to be traded as well. I'm a little rusty on the terminology, so thankfully CBOE provided a handy explanation:
Asian options:   An Asian option, also known as an "averaging option," is an option whose settlement value is based on an average of the underlying index closing prices throughout the contract's life, as opposed to the single price at expiration.
Cliquet options:  A Cliquet option, sometimes referred to as a "ratchet option," is a series of at-the-money forward-start options where the total premium is determined in advance. CBOE is expected to offer a specific type of Cliquet known as the monthly sum cap with a global floor where the option holder receives the greater of zero or the sum of monthly capped returns.

This is obviously another effort from CBOE to capture some part of what now is on OTC derivatives market. With credit lines being what they are after 2008 it would make sense that fraction of exotics trading would end up facilitated by a major exchange and centrally cleared

So far  FLEX options have been a good way to be taken for a ride: from the first and second-hand stories I heard, you would pay huge bid-ask spread entering a trade, and there is no liquid market to exit the option, so you either hold to expiration or pay another huge spread to exit.

However I am excited about the development - if we see some volume in these contracts, it is not impossible that some market maker would step forward and request that they will become listed, probably on SPX Index. My bet is on Asian options, as they are more vanilla-like, and (highly non-technical description) trade at effectively lower volatility because of averaging.

Some New Developments In Volatility Calculations

If you're working with daily data (without access to intraday data) and need to calculate volatility, then using close-to-close squared returns is by far not the best way to go. Trades and quants know that it is a very noisy metric, and come up with few work-arounds. In this post I will do a very quick review of some available options, as well as new developments. I am not planning a thorough review or comparison, rather just to offer my personal opinion, based on practical experience of what works better.

Quants tend to like either modelling some long-term average of daily squared returns (which introduced autocorrelation), or using GARCH to filter out smooth volatility process based on the data. GARCH model of daily returns, in my experience, also performed quite poorly, especially in forecasting future volatility.

Traders tend to use ATR - average true range - as a measure of price variability (quick tip: daily volatility ≈ ATR / stock price / 1.6). Another very similar estimate based on squared range, called Parkinson's volatility estimator.

Better volatility estimates have been devised: Garman-Klass and Rogers-Satchell volatility estimators are much better than others mentioned above. Yang-Zhang estimator has theoretically even higher accuracy, but works only for multi-day estimates. Magdon-Ismail and Atiya published another estimator but (according to their own research) it works only slightly better than R-S and G-K estimators, while being much more complicated from computational point. A quick note about the formulas to the right - similar to Y-Z estimator, G-K and R-S can also be adjusted to include overnight return,
see e.g. this.


Recently there were three interesting developments in estimators based on OHLC data.

Last year Bruno Dupire introduced what he called a Move-based estimator, a volatility estimate that reflect the cost of option hedging. I have to honestly admit, that after reviewing the presentation several times I still don't understand how the estimator is derived. If you can explain it to me, please email or comment below.

Jerzy Pawlowski created a skew-like and moment like estimators based on OHLC data, here slides 6 and 7, with R code available here.

Finally, not quite recent (2008) but also important is this correlation formula from Rogers and Zhou.

Triple Expiration

Next time, for the first time in SPX history, we will have 3 expirations in one week: on Monday Feb 29 month-end options will expire, newly listed Wednesday weeklys will expire on Wednesday Mar 2, and "regular" weeklys on Friday Mar 4. All of the options expire in the PM. And I have positions in all 3.

Speaking of Wednesday weeklys, the launch was a clear success. On the first day of trading - this past Tuesday, quotes width was somewhat sporadic, but the last few days I see that the width is pretty much like a regular weekly expiration, with volume and open interest also at quite respectable levels.

Old VIX vs New VIX - Simple Explanation

CBOE started disseminating VIX index in 1993. At that time the index was based on OEX (S&P100) options, that were most liquid index options at the time, and was calculated using weighted average of Black-Scholes implied volatility of ATM options. Ten years later CBOE changed the calculating, moving from OEX to more liquid SPX options, and also, most importantly, completely changing the calculation formula.

This formula for new VIX is not intuitive, and is quite complicated, but I will explain both old VIX formula and new VIX formula in simple geometric terms. Let's create a chart of options prices, calls and puts, vs their strikes. You will end up with a chart that looks something like this -


If options are relatively expensive the lines would be higher; if options are relatively cheaper the the lines would be lower. At one point, these lines will intersect, and the strike where they intersect will be very close to where the underlying index is trading. And the height of the point where these lines intersect is (approximately) proportional to the old VIX value. If volatility is high, then options are expensive, and the height of intersection point will be higher. If volatility is low, the height will be proportionally lower.

The math behind this is based on approximation for the price of ATM straddle ≈ 0.8  * index price * volatility * √ time to expiration  In our case, volatility ≈ height of the intersection point (0.4 * index price * √ time to expiration  )

New VIX is calculated in a very different way, but also has the place on the chart. Take the area under the call and put curves, that looks like a curved pyramid.


The area under the curve is (approximately) proportional to the square of the new VIX! This is something that I covered in a previous post, so for the sake of not repeating myself I will just summarize:

old VIX is proportional to the height of the pyramid, new VIX is proportional to the square of the area of the pyramid. 

This connects two ideas, and also shows how new VIX uses information from all options, as opposed to the original VIX that uses only ATM options.

CBOE to List SPX Wednesday-Expiring Weeklys Options


CBOE announced yesterday that they will start listing SPX weekly options series with the same expiration time as VIX options. While it is not clear from the press-release, the circular clearly states that new options will be PM-settled, adding half-day of basis risk for traders. Overall I think this contract specification is somewhat surprising, but let's go over the history of VIX to understand CBOE's position.

Original VIX, as introduced by CBOE in 1993 was based on OEX (S&P100) options, most liquid index options at the time, and calculated by interpolating Back-Scholes implied volatililities of ATM options; OTM options did not figure in the calculation. VIX was already in use for 10 years, when in 2003 CBOE updated VIX methodology in two ways - first, moving from OEX to SPX, more liquid index options market, and changing the calculation to be in line with a formula for a variance swap - an OTC instrument that allowed for a pure (as in no delta, no rebalancing required) bet on variance.

While not exactly the same (VIX is a square root of var-swap, a non-linear transformation which makes static replication impossible) VIX futures and options became a class of its own. The original foundation of VIX vs basket of 30 day SPX options became less important as VIX complex became the dominant market leading the price discovery in volatility.

However that led to some inconvenience for traders - if you have two correlated markets like SPX and VIX, and you treat them as observable (as opposed to some model based latent quantity) you would want to naturally trade one against the other. However with Wednesday vs Friday expiration this adds significantly to residual risk. But current solution (Wednesday PM) begs a question - why PM? Trading VIX vs SPX Wedensday options still leaves half-day of difference?

I called CBOE (so you don't have to) asking for a comment. After being transferred from one person to another I received an answer that can be summarized as "we cannot comment on product design decisions" . Basically what it means is that CBOE decided to add another day for expirations, and designed the product to be similar to existing weeklys (PM). They were not meant to perfectly align with VIX complex, despite what it says in the press-release.

FWIW I think this is actually an unfortunate decision, and lost opportunity for CBOE.


Weekly market report

Wall st delivered a mixed bag of news with VIX, VNKY, and VSTOXX and their underlying markets almost unchanged. VXD - volatility index based...