For the sake of complete transparency I keep a log of all forecasts made on the blog - this way you can plainly see if my model is valid, or if it is full of sh!t. The end of the year is a good time to summarize forecasting performance. 2011 was not an easy year marker with completely unforeseeable earthquake in Japan, political events in Egypt and Libya, and Sovereign Debt Crisis, but the VIX model performed well.
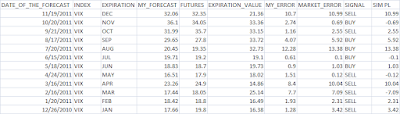
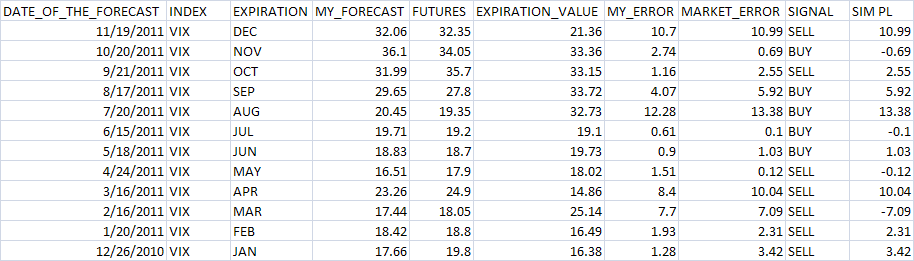
Of the 12 forecasts my forecast error (calculated as absolute difference between my forecast and VRO - VIX settlement value) was smaller than the market's 8 times out of 12. The average error was 4.44 vs 4.80 in the futures. Simulated trading signals also performed well - there were 5 buys signals and 7 sell signals with simulated PL of 41.64 VIX points, or 3.47 VIX points per month. For simplicity transaction costs are not taken into account. There were 4 negative months and 8 positive ones. While most of the profit was made in 3 months with PL over 10 VIX points, the model is positive even after removing these 3 top months.
Of the 12 forecasts my forecast error (calculated as absolute difference between my forecast and VRO - VIX settlement value) was smaller than the market's 8 times out of 12. The average error was 4.44 vs 4.80 in the futures. Simulated trading signals also performed well - there were 5 buys signals and 7 sell signals with simulated PL of 41.64 VIX points, or 3.47 VIX points per month. For simplicity transaction costs are not taken into account. There were 4 negative months and 8 positive ones. While most of the profit was made in 3 months with PL over 10 VIX points, the model is positive even after removing these 3 top months.


No comments:
Post a Comment