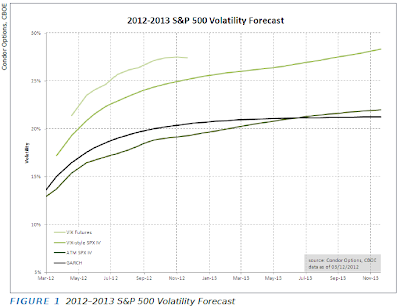
The chart above was taken from March issue of Expiring Monthly magazine (with author's permission, of course) . The article titled "2012 Volatility Forecasts for the S&P 500" Jared Woodard writes about structural differences between the products. I wanted to try more mathematical view, however I did not make significant progress in explaining the difference. Below are some thoughts and ideas I came up with.
Ignoring GARCH which is a statistical model we have 3 different expected volatility curves: ATM Implied vols, VIX-style vol, and VIX futures. The interesting thing is that all three are quite different mathematically. If we gloss over some technicalities I figured as follows:
let r be the return of underlying index from time 0 (today) to T (expiration). Lowercase t is 30 days before T and denotes VIX expiration date. Subscripts have been added for clarification.
Explaining VIX futures is trickier - the term under the square root is forward volatility from VIX expiration to SPX expiration, and is not the same as two volatilities above. I could not figure out how to make a direct connection to the volatilities above, but will note that VIX futures price is <= to the square root of forward variance, which can be calculated from VIX-style IVs, see Tale of Two Indexes, formula 11.


No comments:
Post a Comment