VXEEM - Emerging Markets Volatility Index Futures Coming To CBOE

CBOE announced that they are launching VXEEM futures on January 9th 2012, and I think there is a good chance the product will take off. At the time when CBOE launched GVZ futures they did not have DPM, however they do have DPM now for VXEEM futures. Also VXEEM has similar dynamics to the VIX, and hopefully that will create some liquidity spillover. Of course I should mention in the timeline of listed volatility products there are many more delisted and inactive volatility products than there are successful ones, but I hope  with coming listings of volatility products (VNKY, VHSI, etc) that we will finally see volatility futures as the first-rate products.

P.S. No date for VXEEM options launch.


VHSI Futures: HSI Volatility Index Futures to Trade on HKEx

Another exciting development in the world of listed volatility products: Hong-Kong Exchange announced listing of futures on VHSI Index at the end of February 2012. This will bring the number of volatility futures products to 5 adding to VIX in the US, VSTOXX in Europe, RTSVX in Russia, VNKY in Japan that are also being launched next year.

News release with product specifications here, Risk magazine article here.

Two months ago I actually mentioned the possibility of VHSI futures on my blog:  "Hang-Seng Indexes Company announced some technical changes to calculation of VHSI - HSI Volatility Index. I am speculating that there is usually no reason to change index methodology unless the exchange is planning to do something, and it may indicate the first step toward Hong-Kong volatility derivatives"

P.S. See my update on VHSI Futures here. 

Expiration Analysis

VIX and VSTOXX finished at their lowest levels in months: VRO - VIX expiration value for December is 21.36, and VSTOXX Index closed Wednesday session at 30.26. Both numbers are siginificatly lower than the forecasts that I made last month, as the markets reacted to a number of good news items from Europe, and possibly end of year seasonality. My direction forecast for VIX was correct, while VSTOXX was not. This unfortunately seems to be the pattern lately - my VIX forecasts are more accurate on the direction than VSTOXX, especially when direction signals disagree.

My forecast for next expiration is for VIX to close at 23.10 vs 24.50 in the futures, and VSTOXX to close at 30.48 vs 32.25 in the futures. Futures prices are Wednesday settlement prices. As before all the forecasts are saved in forecasts tracker page.


Leveraged ETFs: Volatility Skew 2

In the last post I mentioned two models that I developed for translating volatility skew of a main, liquid ETF to volatility skew of a leveraged ETF. Even though these models are not in production (or even production quality, at this stage) I cannot disclose the formulas. However I wanted to show something, so I created these plots to illustrate them on a concrete example: fitting volatility data of SPY etf (january expiration, static snapshot of the data taken few days ago) and creating volatility skews for SSO, SH, SDS, and SPXU.

Market implied volatilities (mid) are in blue. Two models - "red" and "green", with maximum absolute error in vol points between model and market. Neither of the models performs excellent, but red model seems to be particularly bad. Models particularly disagree in the extreme tails, which is not really surprising. If I will have the time, in the following post I will compare results from my models to Zhang's non-parametric approach.


Leveraged ETFs : Volatility Skew

There is very little research available on taking volatility skew from regular (liquid) ETF and producing skew for inverse / leveraged ETF. Another related problem is producing consistent volatility skews between ETFs with the same underlying but different leverage factors.

The only source that I know of is PhD thesis of Jian (Stanley) Zhang, "Path-Dependence Properties of Leveraged Exchange-Traded Funds: Compounding, Volatility and Option Pricing" available for download here. The author presents 3 approaches to the solution.
  1. Author calibrates observed liquid options prices to Heston model and computed options on leveraged ETFs using MC. 
  2. Second approach is to compute prices of options on leveraged ETF as linear combination of "regular" ETF options, a-la var swap from options prices.
  3. Non-parametric skew model that translates "regular" ETF skew into leveraged ETF skew.
While research is certainly groundbreaking, these approaches suffer from some shortcomings. The first two are not directly application to American options, while the third lacks theoretical justification.

In the following posts I would like to elaborate on Dr Zhang's nonparametric approach, as well as two parametric approached that I developed. 

Leveraged ETFs & Decay

There are plenty of things written about leveraged ETFs and their apparent decay based on empirical observation that both bull and bear products often underperform the benchmark. The usual explanation (and the one that makes most sense to me) is that ETFs don't really decay - just appear to be doing so because higher leverage lowers median - the most likely - price, but expected value remains unchanged. Jev Kuznetsov covered the topic few months ago on his blog.

Recently I started working on leveraged ETF models, not for the underlying but for options on leveraged ETFs, and spent more time thinking about the basics. Someone asked me if distribution of "regular" ETF returns is not gaussian, would leveraged ETF price still be a martingale. In retrospect the answer should have been trivial: if E[S*(1+r)]=S, then E[r]=0, and E[L*r]=0, and therefore E[S*(1+L*r)]=S, where S is price, r is return, L is leverage, and E is the expectation operator.  However I did not figure this out right away, and was not sure about the answer. Most of the "basic" illustrations are based on binomial tree that converges to gaussian, and I did not see the same illustration being done for distributions with excess skew or kurtosis.


Here is the usual binomial tree for an ETF. The instrument moves up 10%, or down 10 %. Implicit in the plot are probabilities of up and down move - in this case both equal to 50%. It is easy to verify that the ETF is a martingale, i.e. the expected value does not change. Leveraged version of the ETF is also a martingale.


Now, let's consider a different type of binomial tree, where probabilities are not the same.


Here the ETF moves up x and moves down 1/(1+x). In the first case x = 0.1, and stock moves up to 100 * (1+x) = 100 * 1.1 = 110, and moves down to 100 * 1/(1+x) = 100 * 1/1.1 = 100 / 1.1 = 90.90. Probabilities are of course cannot be the same. To calculate probabilities I solve equation [1 = p*u + (1-p)/u] for p; p = (1/u - 1)/(1/u - u). In our case (1/1.1-1)/(1/1.1-1.1) = 0.47619 , and 100 = 110 * 0.47619 + 90.90909 * (1-0.47619). Similarly for the second step, terminal probabilities are 0.47619^2 = 0.226757, 0.47619 * (1-0.47619) = 0.249433, and (1-0.47619)^2 = 0.274376; expected value is 0.226757 * 121 + 0.249433 * 100 + 0.249433 * 100 + 0.274376 * 82.64463 = 100


Double-leveraged version works as expected. All these examples are trivial - ETF is a martingale, binomial is gaussian in limit. However we can also construct a trinomial tree that can simulate probability distributions other than gaussian.


Up and down moves are chose arbitrarily, while the middle move is set to sqrt(up*down), so the tree recombines. For clarity's sake I drew all nodes. Probabilities are constrained to sum up to 1, and to produce a martingale - p1 * up + p2 * mid + (1-p1-p2)*down = 1. In the illustration my price multipliers and probabilities are:


Leveraged version does not produce a trinomial tree that recombines, but price still remains a martingale.


In the following posts I will address the topic of constructing consistent volatility skews for regular, inverse, and leveraged ETFs.

Expiration Analysis

Volatility indexes traded in a broad range with politically-driven swings. VIX rose 0.21, and VSTOXX fell 1.81. I managed to be wrong on both directions for the index futures - you can see my complete forecasting track record on Forecasts Tracker page. There is a lot of uncertainly going forward because political factors are driving the market and these things are not something I can forecast with a statistical model. Still - for the next expiration I predict
VIX to close at 32.06 vs 32.35 in the futures, 
VSTOXX to close at 38.31 vs 37.95 in the futures. 
Futures prices are Friday settlement.


Weekly market report

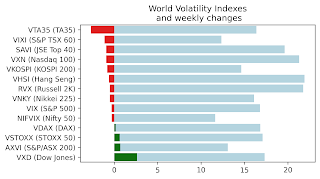
Wall st delivered a mixed bag of news with VIX, VNKY, and VSTOXX and their underlying markets almost unchanged. VXD - volatility index based...