8 Simple Rules For Measuring Risk

Below I describe fast and easy heuristics that relate the price of ATM straddle to expected volatility, range, high, low, and maximum drawdown. These formulas may be useful to traders to quickly reassess their trading positions after a jump in price/volatility, or provide alternative view for a fair value of an option based on traders’ opinion on expected range, for example calculated from support / resistance levels.

To derive the formulas I assume the price follows arithmetic Brownian motion with no drift, and zero interest rate. These assumptions or course are not realistic, but quite workable for short-dated options, or for small volatility. The advantage of making such assumptions is great simplification of formulas. Heuristics work well for stocks and currencies, where there is no mean reversion in price, but would not work for interest rates, or VIX index.

1. Expected price volatility ≈ 1.25 * ATM straddle
2. Expected price range = 2 * ATM straddle
3. Expected high = current underlying price + ATM straddle
4. Expected low = current underlying price - ATM straddle
5. Expected maximum draw-down ≈ 1.6 * ATM straddle
6. All the formulas are linear in underlying price
7. All the formulas are linear in return volatility
8. All the formulas are linear in √T

Example: IWM closed today at 63.98. Strike-64 straddle expiring on 21-Aug-2010 closed at 5.21 using mid-market prices. The expiration is in 27 trading days.

1. Expected volatility (until expiration) is $6.5. This can be translated into implied by 6.5 / 64 * √252/27 = 31% ( which is about 0.5 points away from implied that I see in my software ) . Daily volatility is of course 6.5 / 64 / √27 = 2%.

2. Expected price range, that is expected high - low is $10.42. Daily expected range is 10.42 / √27 = $2

3. Expected high (resistance) is 63.98 + 5.21 = $69.19
4. Expected low (support) is 63.98 - 5.21 = $58.77
5. Expected MDD is 1.6 * 5.21 = $8.34

Over the next month I'll keep an eye on how these implied measures compare to realized, and will write an update after Aug expiration. Hedge your deltas!

Volatility Around The World


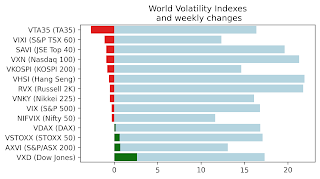
After a short trading week, S&P was up every day, gaining over 5%. Volatility indexes around the world lost 18%, or 5 volatility points. The biggest loser was VFTSE down 7.7 points, while FTSE was up 6%.

VIX index lost 5 points, distant month VIX futures losing 2.6 points. My forecasting model predicts further decline in the VIX over the next few months, however I'm still surprised as to how volatile the back-month futures can be.

There was a technical problem with VXJ update, so the value is the same as last week.


Shorting VXX riskier than appears

VXX has been going down since the day it listed, losing on average 8% per month (using data since inception until friday close), so it's not really a very original idea to short it. I did not short the ETF outright, but put on a few small bearish option positions. However the other day I got around to do some digging and found out a few things that I did not know.

EDIT: earlier I wrote that VXX lost about 10% per month. That figure was based on calculations I did few months ago - in the first year of trading VXX declined from 104.58 to 31.64 at a rate of 9.9628%, which I rounded to 10%.

Why did VXX decline so much? As Bill Luby and many others explain there are two reasons: the term structure of VIX futures, and trading costs. Most of the time VIX chain is sloped upwards (contango), that is front month futures are cheaper than the second month, making the roll costly. I collected data from the beginning of VIX futures trading until the end of last year. While I did not simulate the exact rolling algorithm used by VXX, I used rolling just once a month, on the expiration day. What I found is that the average difference between the front and second month futures to be 0.8 VIX points (t=2.47), or 6.7% of VIX value (t=6.03), and second month future is more expensive than the front in 82% of cases (53 out of 64). These costs do not include the bid-ask spread; they are statistically and economically significant.

However this is not a complete picture. Since VXX has about year and half worth of data, I needed to look for more. VXX is based on SPVIXSTR - S&P 500 VIX Short-Term Futures™ Index (overview here). I was able to find historical data for the index, and reproduced the chart below. It is clear from the chart that while the index has been in a steady decline since volatility peak in late 2008 (VXX was launched shortly thereafter in January 2009) going short the index would not have been without significant risk.

In four and a half years (54 months) since the index inception it declined on average by 1.65% per month, much less than 8.3% for VXX. While 1.65% is still significant, it pales in comparison to the maximum drawup (maximum drawdown for short-seller) of 523% from the low of 37,098 in Feb 2007 to the high of 231,276 in Nov 2008. For the life of the index the average drawup is 94%! I used simple returns for drawup calculations.

Now to put things into perspective, during the last 17 months for which VXX existed, VIX declined from 44.84 to 24.98, at a rate of 3.4% per month vs, 8.3% for VXX, and 8.0% for the SPVIXSTR. In the past 54 months VIX rose from 11.19 to 24.98, at a rate of 1.5% per month, while SPVIXSTR declined at 1.6% per month.


To measure the risks I conducted two studies - Monte-Carlo on index returns, and a parametric model like the ones I described last month. I used the two methods to generate forecasts for VXX and VXX options, and while I won't share the details, I realized that what I saw as a relatively low-risk opportunity in VXX, was rather moderate risk, low-edge trade.

Volatility Arbitrage (?)

I don't know how big the bid-ask spread is in VSTOXX futures, but this chart based on Jul 6, 2010 prices from the two markets should make you think about putting on some trades. Coming soon - vol skew comparison between the options markets.


Edit: VSTOXX spreads are about 0.5, VIX spreads are about 0.1.

Week in Volatility


VIX futures are up this week, and in an interesting pattern - distant months rose more that the near months. This is an unusual pattern since most of the time the volatility and sensitivity to spot index declines as one goes out further in expiration.


I have not researched the historical patterns of term structure, but I recall seeing a similar pattern in the spring - summer of 2008. After a spike in May, front months declined, but back-month futures stayed relatively expensive, or rose. I wonder if this is a sign of upcoming vol spike.

Elsewhere on the web SurlyTrader notes a bump in the term structure of VIX futures as opportunity for a calendar spread between October and December. See follow-up comments to the post.

Volatility Around The World


Markets fell again, S&P declining 5%, with gap on Tuesday morning and another large decline Wednesday afternoon. Volatility indexes around the world rose by almost 2 points, or 7.5%.

While compiling different volatility indexes I noticed some surprising extremes - India VIX, and Mexican volatility index in low 20s while VIX is at 30. Why is that volatility in emerging/developing markets is lower than US? Is it because of USD exchange rate risk, or something else? I really don't know.

In addition - US-traded ETFs do have higher ATM volatility (all numbers approximate b/c of large bid-ask spread)
INP (India) - 30%
EPI (India) - 30%
PIN (India) - 33%
EWW (Mexico) - 33%

It is possible to arb between domestic and US volatility? I don't have access to foreign markets, but other traders possibly could.

Cornucopia of volatility indexes

I have been slowly adding to my database of volatility indexes. Here's the list I have assembled so far:

VIX - S&P 500
VXD - DJIA
VXN - Nasdaq 100
RVX - Russell 2000
VDAX - DAX, Germany
MVX - S&P/TSX 60, Canada
VSMI - SMI, Switzerland
VFTSE - FTSE 100, UK
VSTOXX - EURO STOXX 50, Europe
VAEX - AEX, Netherlands
VBEL - BEL 20, Belgium
VCAC - CAC, France
VXJ - Nikkei 225, Japan
India VIX - Nifty 50, India
VIMEX - IPC, Mexico ( unlike other indexes it targets 3 month volatility )

And also commodity volatility indexes based on ETFs:

EVZ - FXE, Euro
GVZ - GLD, Gold
OVX - USO, Crude Oil

Weekly market report

Wall st delivered a mixed bag of news with VIX, VNKY, and VSTOXX and their underlying markets almost unchanged. VXD - volatility index based...