3 Important Probabilities for Leveraged ETF Investors

In Leveraged ETF and CPPI type Strategy by Bertrand and Prigent I came across an interesting formula: probability of leveraged ETF declining in value while regular fund increases.

Over a period of one day correlation between returns is close to one, but over longer time periods funds usually diverge significantly, that it return of leveraged fund is not leverage times regular funds return. Particularly disappointing situation for leveraged ETF investor is when over some period of time regular ETF increases in value while leveraged ETF declines.
------------------------------------------------
Example 1: consider SSO - ProShares Ultra (leverage_factor=+2) S&P 500 ETF. SPY volatility is about 20%. Expense ratio for SPY is 0.09%, for SPXU 0.91%. I don't know the short rate for SPY but let's assume it is zero. If investor is bullish on the S&P 500 and decided to buy SSO and hold it for 1/2 year, there is 3.31% chance that SSO ill decline even if the investor is correct in the forecast (SPY increases). Even for a relatively short time period on one month such probability is 1.36%.
------------------------------------------------
The formula by Bertrand and Prigent is based on assumption of continuous brownian motion, and is fairly accurate approximation for discrete process. The formula they derived works only for positive leverage, but not for inverse ETFs. I derive formulas for inverse ETFs and also extend their work for different drift conditions, like expense ratios.

The applet below is interactive, but may be a bit slow to update. You can download the spreadsheet on your computer by clicking on Excel button.


Inputs are: leverage factor (negative for inverse ETFs), time in years, volatility of regular ETF (leveraged ETF will have volatility times |leverage|), financing rate, and two drift parameters (for example annual expense ratio of 1% would be -1% drift) Leveraged ETFs usually have higher expense ratios, so I separated the two parameters.

Outputs are: reg pos lev neg - probability that regular ETF will have positive return while leveraged ETF will have a negative return, reg pos lev neg (inv) - same for inverse ETFs, and reg neg lev neg (inv) - probability that both funds decline in value. The reason for two formulas for inverse ETFs is that inverse ETF is "expected" to decline when regular ETF rises in value. Last probability is the disappointing scenario of regular ETF declining, and inverse ETF declining as well.
------------------------------------------------
Example 2: consider SPXU - UltraShort (leverage_factor=-3) S&P 500 ETF. SPY volatility is about 20%. Expense ratio for SPY is 0.09%, for SPXU 0.93%. I don't know the short rate for SPY but let's assume it is zero. If investor is bearish on the S&P 500 and decided to buy SPXU and hold it for 1/2 year, there is 11.77% chance that SPXU will decline even if the investor is correct in the forecast (SPY declines as well). Even for a relatively short time period on one month such probability is non-trivial 4.83%.
------------------------------------------------
Financing cost is the cost to the ETF provider to create leverage - borrow rate for positive leverage ETFs, and short rate for inverse ETFs. I assume that (like in the current environment) one would have to pay both.

cost = IF(leverage_factor>0,rate*(1-leverage_factor)*time,rate*(leverage_factor)*time)

Terms in B9, B10, and B11 are generalized from Bertrand and Prigent's paper. First result is theirs as well, the last two are my contribution.

If you are using the formulas on your blog, website, or research please acknowledge the original source.


Leveraged ETFs Research: Volatility Skew

I have blogged before about inverse and leveraged ETFs, about how their performance depends on their volatility, and also about pricing options on these ETFs. While I try to focus specifically on original research, here are some important research publications from academia, along with my comments.

Volatility skew of leveraged and inverse ETFs is a topic that is dear to my heart - I recently left a trading firm that specializes in volatility arbitrage in ETF space, where over the past year I conducted mathematical research and developed software to create a comprehensive trading system. It is now in production on (almost) all US optionable ETFs. Unfortunately my contract prevents me from disclosing any details about my own research.

1 Dr Jian Zhang thesis, which I believe is the first publication to address correct pricing of LEFT options. I wrote about shortcomings of his three approaches in my previous post.

2 Consistent Pricing of Options on Leveraged ETFs by Andrew Ahn, et al, first provides an important generalization for pricing LEFT options, applying it to Heston model, and also 2 jumps models via Monte-Carlo. They show experimentally model-dependency (that results from path-dependency) for pricing LEFT options.

3 Most recent, is Implied Volatility of Leveraged ETF Options by Tim Leung and Ronnie Sircar. They apply stochastic volatility-based iv asymptotics framework developed in Multiscale Stochastic Volatility for Equity, Interest Rate, and Credit Derivatives, which is an excellent book! Authors also address the issue of different volatility premiums across related products.

4 Structural Slippage of Leveraged ETFs by Doris Dobi and Marco Avellaneda "shows" that you can make money by shorting ETFs and capitalizing on slippage. Despite their findings I don't this that there are any serious money to be made here - 1 borrowing costs are collected from a retail, not institutional broker, 2 actual borrowing costs are not known until stock settles, 3 execution slippage is usually highest at the time of greatest ETF decay. 

Leveraged ETFs Decay And Symmetric vs Skewed Distributions

It has been already widely discussed that LEFT do not decay in the conventional sense like for example options. As a simple thought experiment consider an options that has non-zero Θ even when underlying is not changing in price. Unlike options, LEFTs will not move if underlying ETF or index does not move. The reason why we usually observe downward drift in leveraged ETFs is due to mean-median divergence, and I will try to provide an intuitive explanation of this phenomenon without unnecessary mathematical formulas.

The only working assumption that I will use is that the asset price distribution is "fair", i.e. its expected value tomorrow is it's price today. Also, purely for illustration purposes I made up an ETF with leverage = 1.5 to better show how properties change as leverage factor is increased.

Many people have a mental model of ETF prices changes as a fair process - something like 50% chance it will go up a dollar tomorrow, 50% chance it will fall down a dollar - or some kind of symmetric price distribution.


As leverage and volatility increase, distribution becomes wider, as greater range of prices is possible. However any symmetric distribution of prices has one major problem - they allow negative prices. This is particularly obvious with higher volatility charts - the probability at zero price are greater than zero. A quick fix would be to truncate such distribution at zero, but that would break the symmetry. Practically, symmetric distributions of prices do not have economic sense.

Breaking the symmetry of price distribution however requires an adjustment - consider the case of truncated distribution: now the probability mass to the right of center (median) will be greater than the left, and will "create" expected price higher than what we started with. To make it fair we would have to lower the center (lower the median) and extend the right tail.


The expected price (mean) in all charts is the same, however the center (median) of the distribution decreases as we increase leverage. In simple words we are more likely to see lower prices as leverage is increased. That does not mean that there is a negative drift - the increased likelihood of lower prices is compensated with larger right tail.

The distribution that I used in the last chart - lognormal distribution - has been widely criticized as a poor model because it does not empirically match the likelihood of rare but extreme events, such as crashes. However the arguments that I made above do not depend on assumption of lognormality; they hold for other fat-tailed distributions as well. 

Robustness of the Black-Scholes Model

Jared Woodard at Condor Options published an excellent post today - his thoughts on research paper by Carol Alexander et al on hedging efficiency of different models. From my experience - as someone who has worked for over 10 years in options market making these results are not surprising.

Pricing model standard deviation of PL, smaller is better. From condoroptions.com with permission.


1 SABR model is my preferred model for pricing and hedging, although in production I used few critical adjustments to the original version.
2 BSM adjusted: in the research paper the adjustments that were made seemed to be quite ad-hoc, but in the performance adjusted BSM is (apparently) not far from SABR. I think this is because S&P has a lot of strikes and allows for a good (robust) fit of skew and kurtosis adjustments. I doubt this would work for option chains with very few strikes.
3 Normal mixture is worse than flat vol BSM, but with adjustments it was better than BSM. This one is not easy to explain. If normal mixture is worse than it is probably due to bad fit, instability of parameters, basically lack of robustness. But why did hedge adjustments improve performance? I don't know.


BAC Dividend Trade

BofA Unit Said to Lose Millions on Options Error

WSJ reported on Friday that Bank of America Merrill Lynch lost about $10M on SPY dividend trade. I cannot comment on veracity of the story but explanation provided in the article is incorrect in their description of the dividend trade.

The article writes "Usually shares move lower after this date, so call options that give the holder the right to buy the shares also decline in value. Market makers familiar with the process may look to profit from the scenario by selling borrowed call options with the intention of buying them back later, when the contracts are cheaper." , and later "Critics of the strategy charge that it takes advantage of investors that haven't exercised their call options before the ex-dividend date, and don't have the resources to transact big options plays."

That is not quite how the dividend trade works ...
First, let's start with options pricing - dividend is an expected and deterministic stock move, and it is completely priced into the option price. Not only theory of pricing options on dividend paying stock is known and well developed, but also every professional options trader knows dividends and prices options accordingly. If they were not - it would create an arbitrage opportunity, and market-makers are smart enough to prevent them.

Second, while short selling stocks works as selling borrowed shares and buying them back, an opening trade in options creates a long position for a buyer, and a short position for a seller. There is no transfer of security like it is with stocks.

Third, dividend trade works not by just selling an option that is expected to drop in price after dividend, but rather as quoted above - by hoping that holders of long options (which market maker is short) will not optimally exercise them. Market makers usually create Δ-neutral spreads in deep call options (edit: or even on the same strike by trading back and forth - the position is not zeroed out for clearing purposes until it settles at t+1), and hope that short leg will not get exercised. In case of correct exercise market maker breaks even;  if option is not exercised the market maker gains dividend without stock risk. Some exchanges - ISE - are particularly against the strategy, because it creates significant risks if the underlying makes a sharp fall, and options spread suddenly gains gamma. Other exchanges - PHLX - are welcoming the practice; from what I know dividend trade accounts for most of the volume on that exchange.

It is true that the strategy takes advantage of investors who don't exercise their options - which is true of most trading - being smarter than the other guy. The other piece of criticism - about not having resources - that is also true - dividend trade is a low-margin activity, and only traders with low costs can take advantage of them.

P.S. ISE paper with very clear explanation of dividend strategy.

Backtesting ETFs

Institutional Investor magazine recently published an article titled "Study Finds Many ETF Indexes Misleading". For me and for other readers of this blog I'm sure this hits home, especially in terms of performance of VIX-related ETFs. Over the last two years that I wrote about several ETFs and ETNs and tried to provide some sort of guidance on their future performance based on past data. While some were relatively easy to reconstruct and explain, other products were more complicated.

For example, in Jan 2011 I posted my analysis of XVIX with quite optimistic projections. The performance since publication over the last year and a half was disappointing -8%, with maximum drawdown of ~22%. While the balancing rule for the ETF was simple: -0.5 * VXX  + VXZ, rebalanced daily, after all things taken into account (including 0.85% fee from the issuer) the volatility risk premium, or term structure trade simply did not work out.

Another forecast I made turned out better - XIV and other daily inverse ETFs performed quite well in the last 1.5 years - XIV rose 71% , although with 49% drawdown between March 2012 and June 2012.

Predicting future is fundamentally challenging, and even strategies that seem robust do not always perform as expected. Having said that I want to bring another point: there are different trading styles: the ones mentioned above, and others like Mebane Faber's GTAA ETFs (that also so far has disappointed in its performance) are rule-based. My intuition tells me that these type of strategies are most susceptible to data mining bias / overfitting. Strategies that are based on valuation, and particularly on relative valuation seem to be more robust to model error.  However I have no idea how to quantify either one. 

Thomas Peterffy NPR Interview

Thomas Peterffy - founded and chairman of Interactive Brokers recently gave a short interview on NPR (here is a partial transcript and 5 minute condensed interview, here is complete 26-minute podcast) . My first job after college was at IB over 10 years ago, and I have all the respect for him. However I find his commentary about "no social value" to be tendentious - high frequency trading probably has as much social value as reselling Juicy Fruit gum. And Peterffy himself certainly would not be able to become such a success living under social regime.

Peterffy and his firm Timber Hill (market-making branch of IBG) were real pioneers of trading, who in the 70s, 80s, 90s, and most of 00s were years ahead of competition. Exchanges and other options firms were engaging in all kings of anti-competitive tactics trying to slow down Timber Hill - the typing robot is just one of many stories like that. But now that Timber Hill is not a leader in speed (and Timber Hill profits have been in decline)  does it really make sense to start complaining about social value?


Book Review: The Missing Risk Premium

Just finished reading Eric Falkenstein's new book The Missing Risk Premium. I have been a reader of Dr Falkenstein's blog for several years now, and have read his first book Finding Alpha, as well as his academic papers available on SSRN, so I'm quite familiar with the topic - CAPM is wrong, there is no extra return for volatile investments.

In the book Dr Falkenstein leaves no stone unturned in bringing empirical evidence that risk (however defined in a consistent manner) does not have positive correlation with returns, and at higher risk levels sometimes delivers smaller returns (suggesting negative correlation). To quote the book:
"There is no general tendency within a variety of investments such as equities, options, most of the yield curve, high-yield corporate and bankrupt bonds, mutual funds, commodities, small business owners, movies, lottery tickets, and horse races. Indeed, many high-risk assets actually have lower-than-average returns..."
In addition he proposes an alternative theory based on relative utility function - that is people pursue relative wealth and benchmark themselves to the "population" - which reduces risk premium to zero. Practical application suggested by author that one can beat the benchmark on a risk-adjusted basis if one avoids most volatile, or risky in the real sense investments that others make for exogenous reasons. As an example author provides sample Minimum Variance Portfolios that have the same components as leading equity indexes FTSE, MSCI-Euro, S&P500, Nikkei but with weights optimized to minimize volatility (details available in the book and also at  Dr Falkenstein's http://www.betaarbitrage.com/) , and tend to produce similar returns as indexes with about half of volatility.

The book is mostly technical, but without unnecessary math, and is focused on the main thesis - there is no "investment edge" in simply taking the risk. I would recommend every investor keep this in mind.

Bad prices on new Eurex website

A quick note - Eurex unrolled a new website over the weekend, but at the time of writing there is a small glitch  - if you look at individual futures contracts last and settlement prices are rounded to the whole Euro

SEP 2012
OCT 2012

but they appear normal for on a different page (select "all expiries" on the dropdown)

ALL EXPIRIES
P.S. Fixed.

Volatility Report / VSTOXX Robust Growth


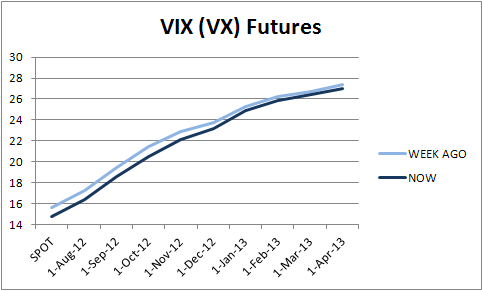
Equity indexes were up/mixed and volatility futures were down this week. The volume is concentrated in the VIX (361318 contracts in the last week), followed by GVZ(449) and VXEM(352). Other CBOE products are showing very little interest - OVX (5 contracts) , VXEWZ (100), and VN(5).

VSTOXX remains the leader in overseas volatility futures trading 42409 contracts last week. In fact volume on VSTOXX futures and options is steadily growing.  I must note that options volume is dominated by block transactions, not screen volume, although futures volume is primarily screen volume. Here is a link to the figures from Eurex.


VSTOXX Futures in the US

CFTC certified Eurex VSTOXX futures to be eligible to be sold and traded by US investors. This creates opportunity for statistical arbitrage between two contracts that already have significant time overlap: VIX Futures open at 7 am Central Time, while VSTOXX Futures close AT 17:30, with with 7-hour difference creates overlap of 3 1/2 hours.

Exchange circular Eng, Deu. Related article from Risk magazine.

TVIX Vol & Applets

One of the blog readers emailed me the following question: [What is the] amount of vol in every 10k shares of tvix. Is it possible to break it down to spx terms (straddles) or what you are buying along the curve?


I answered as follows: There is no simple answer ... but I'll try to provide so rules of thumb without a formal model . To compare TVIX with SPX straddle, let's consider the simplest case where straddle has 30 days to
expiration, so the same maturity as VIX. VXX , which holds VIX futures interpolated to 30 day maturity will have about 0.5 β to the VIX, and TVIX will have β about 1 (that is actually when I get from regression) . [Edit: to clarity VIX has maturity of SPX + 30 and beta ≈ 1, VXX SPX + 60 and beta ≈ 0.5]

Since ATM straddle is approximately linear in vol, % change for 30-day ATM straddle would be about the same as % change in the TVIX. This is of course a "local" relationship. As the straddle moves around it will no longer be ATM and will lose or gain Γ, so the relationship will change.

To generalize this to any maturity you would have to figure out how vols move. Again, without having a formal model the rule of thumb is that vol changes are inversely proportional to sqrt(T). So if 1 month straddle has β = 1, 4 month straddle will have β = 0.5, and half-month straddle will have β of about 1.4.


About 2 years ago I published few posts (1,2,3) about VIX future movements, and used few applets for interactive illustrations. These applets use Adobe Shockwave, and do not work on all browsers. I created them using a product called Xcelcius that was taken over by SAP and as far as I know has been deprecated. Can any of the readers suggest a way for me to create interactive applets to demonstrate non-linear features of VIX products, something simple that would not require significant programming?

Volatility Forecasts


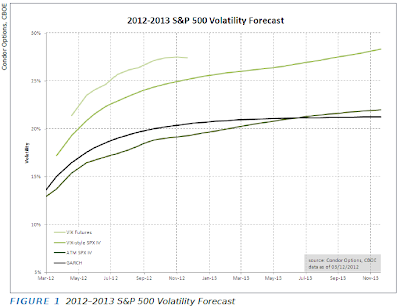
The chart above was taken from March issue of Expiring Monthly magazine (with author's permission, of course) . The article titled "2012 Volatility Forecasts for the S&P 500" Jared Woodard writes about structural differences between the products. I wanted to try more mathematical view, however I did not make significant progress in explaining the difference. Below are some thoughts and ideas I came up with.

Ignoring GARCH which is a statistical model we have 3 different expected volatility curves: ATM Implied vols, VIX-style vol, and VIX futures. The interesting thing is that all three are quite different mathematically. If we gloss over some technicalities I figured as follows:

let r be the return of underlying index from time 0 (today) to T (expiration). Lowercase t is 30 days before T and denotes VIX expiration date. Subscripts have been added for clarification.


ATM IV (Black-Scholes ATM Straddle IV) is proportional to the straddle price. The ratio between ATM IV and VIX-style IV is 1 if distribution is Normal. Using few simulations, and few limited formulas I hypothesize that the ratio is < 1 for leptokurtic distributions (excess kurtosis will influence r^2 faster than |r|), but I was not able to prove it mathematically. Since market returns have excess kurtosis it should not be surprising to see VIX-style IV to be always higher than ATM IV.

Explaining VIX futures is trickier - the term under the square root is forward volatility from VIX expiration to SPX expiration, and is not the same as two volatilities above. I could not figure out how to make a direct connection to the volatilities above, but will note that VIX futures price is <= to the square root of forward variance, which can be calculated from VIX-style IVs, see Tale of Two Indexes, formula 11

Asian Volatility Futures Lack Liquidity

An article about a month ago in the Risk magazine noted the lack of liquidity in asian volatility products. Despite volatility rise and continuing global economic concerns (that seemed to be good for VIX liquidity) futures like RTSVX in Russian Federation, VNKY in Japan, and VHSI in Hong-Kong have not picked up in trading. At the time of writing Nikkei Volatility futures have a total open interest of 107 contracts, VHSI 45 contracts, and RTSVX only 12 contracts. It makes sense that traders are more inclined to use VIX or VSTOXX (European volatility index) futures.

P.S. Interesting presentation from Lawrence McMillan - people paying too much for protection, premiums too high, protection does not work. He mentions that only US markets seem to have term structure "distorted", US being the biggest vol derivatives market. This is definitely something to investigate further.


Facebook Options

Facebook Options listed yesterday on brisk trading and solid volume. There was a lot of interest in 44 and 45 strike in near expirations, but I think this is not from informed trading. Implied volatility remained relatively steady at about 63% level most of the day.


The term structure was downward sloping, as expected (closing vols)
JUN12 - 66%
JUL12 - 61%
AUG12 - 64%
SEP12 - 61%
DEC12 - 58%
JAN13 - 57%
MAR13 - 56%

VXN Futures Listed, CBOE Product Expands To 6

This week CBOE (re-)listed VXN volatility futures bringing the total number of distinct volatility futures to 6. VIX remains the leader in volume, but other products are trading as well: GVZ which I thought was pretty much dead traded 6 contracts, VXEM future - the second most popular CBOE product traded 2955 contracts, VXEW 156 contracts, OVX 416 contracts, and VXN debuted with 39 contracts. 


Volatility ETNs: Curse or Cure?

Carol Alexander and Dimitris Korovilas, both from ICMA Centre published a series of excellent research papers on VIX ETNs: Diversification of Equity with VIX Futures: Personal Views and Skewness Preference, and  Understanding ETNs on VIX Futures. Their latest Volatility Exchange-Traded Notes: Curse or Cure? continues on the topic.


Abstract:
This paper investigates the trading, hedging and performance characteristics of VIX futures exchange-traded notes (ETNs) and discusses their pros and cons from the perspectives of the regulator, the issuer, and the non-speculative investor. Is this direct trading of volatility in very high volumes a major new source of issuer risk and systemic risk? Or – as advertised by the issuers – do these notes provide a unique source of diversification that should be welcomed by investors and regulators alike? To answer these questions we replicate the ETNs daily indicative values from March 2004 – March 2012, showing that the amplitude and frequency of volatility cycles have indeed increased markedly since the introduction of VIX futures ETNs. On the other hand, we explain how long-term investors can build simple ETN portfolios with uniquely attractive performance and diversification characteristics – provided they hold inverse rather than direct short-term tracker ETNs. Then we focus on the ETN issuers’ hedging activities, where the terms and conditions of early redemption provide transparent front-running opportunities for speculators which in turn increases both the hedging error and the volatility of VIX futures. Furthermore the one-day notice period for early redemption presents a moral hazard problem for the issuer. 


My notes: In the section 4.2 Correlation Analysis and its Implications for Roll-Yield Arbitrage Trades the authors show a concrete example of using PCA on vol indexes to create calendar arbitrage portfolios. The first PC explains 95% of variance, which explains the almost-parallel shifts in the term structure, with second component explaining the tilt (3.23% of variance), and third PC explaining the curvature (0.91%) They note that XVIX is historically optimal in return/risk sense, same conclusion that I blogged about when XVIX just launched. Unfortunately XIVX disappointed in its performance.
Perhaps a more interesting application of PCA here would be statistical arbitrage between VIX futures of different maturities, or constructing a combined portfolio with different volatility futures like VXEM, VXEW, or soon to be launched VXN (Nasdaq volatility index) . 

ETRACS planning 6 leveraged ETNs

UBS is planning to launch 6 new leveraged VIX ETNs under their ETRACS brand. The symbols are VXAL, VXBL, VXCL, VXDL, VXEL, and VXFL - they are 2-x leveraged versions of their existing 1 though 6 - month products. At the time of writing their is no information on these products on the ETRACS website, but Bloomberg tickers for the products (VXAL:US, VXBL:US, VXCL:US, VXDL:US, VXEL:US,  VXFL:US) have been reserved. 

DVX - VIX CAD Hedged ETN

DVX ETN
iPath - the leading provider of volatility ETNs is launching two new products in Canada - currency-hedged version of US VXX and XVZ ETNs. To confuse things, the tickers for the ETFs will be VIX (for VXX equivalent) and DVX (for XVZ equivalent) The products provide a transparent way for investors to capture volatility curve alpha while minimizing currency risk. While these particular products are not really that important, I hope that iPath will give US-based investors access to currency hedged versions of VSTOXX-based ETFs that currently trade in Europe, or give European investors currency hedged versions VIX-based products.

VIX prospectus, Fact Sheet, product page.
DVX prospectus, Fact Sheet, product page on iPath website.
I have also added the products my Volatility ETFs & ETNs page.

P.S. 3-May-2012 Added VIX:CN Info

Volatility at Worlds End: Two Decades of Movement in Markets


Chris Cole of Artemis Capital Management has created something really amazing - a muti-media mashup of visualization of the term structure of implied volatility, and historical events over the last two decades. Check it out!

Artemis Capital Management - Volatility at World's End

Christopher Cole just released his latest research letter titled "Volatility at World’s End: Deflation, Hyperinflation and the Alchemy of Risk"

Main topics addressed:
Central Banks, and monetary regimes influences on equity and volatility markets.
Vol/Vol of Vol risk premiums implied by the term structure of volatility futures.
Implication of inflation on stock markets - the right tail risk.
TVIX debacle.

OVX Futures Launch a Dud; GVZ futures back from the dead

Crude Oil ETF Volatility Index launched on Monday did not trade a single contract. Links to market data are absent from CFE website, but datafiles themselves are available:

Volatility futures markets were slightly down - unched from last week. VXEEM  futures traded almost 1000 contracts last week, but VXEWZ was struggling, trading only 157 contracts. Most surprising thing however was GVZ - GLD-based volatility contract launched almost a year ago, that has not traded a single contract in over half year trade one (1) contract on Monday. Probably someone made an error.


Volatility Risk Premium

Volatility risk premium is an important statistic for options traders. It is a single number that estimates premium that is priced in to the options due to volatility of volatility, or jumps. Jared Woodard wrote an excellent research brief on it Options and the Volatility Risk Premium  and I wrote earlier about VRP in stocks and VIX options. Below I compare realized volatility of different stock indexes with their implied volatility indexes, and find considerable dispersion in VRP values. Perhaps this is because there are slight differences in methods used for volatility indexes.


And same data in the raw table form.


Average Implied Volatility Index vs Realized Volatility for the last 5 years
Stock/Volatility Index Realized Implied VRP
NIFTY/INVIXN 30.3801 30.1993 0.10953
RTSI$/RTSVX 42.104 43.0253 -0.78427
RTY/RVX 33.5548 32.4393 0.73617
TOP40/SAVIT40 26.7024 27.2037 -0.2702
ASX/SPAVIX 24.7419 26.1983 -0.7419
DAX/V1X 27.0265 27.349 -0.17533
SX5E/V2X 28.2234 29.1638 -0.53966
SMI/V3X 22.3754 23.1146 -0.33629
AEX/VAEX 27.3087 27.2267 0.044695
CAC/VCAC 28.3253 27.245 0.60033
UKX/VFTSE 24.5219 25.0541 -0.26384
HSI/VHSI 32.7383 31.5557 0.76034
SPX/VIX 26.6402 25.9783 0.3483
SPTSX60/VIXC 15.7155 19.3213 -1.2634
KOSPI/VKOSPI 26.781 27.3645 -0.31593
NKY/VNKY 29.227 29.5678 -0.20037
INDU/VXD 24.1924 23.4958 0.33221
NDX/VXN 27.4897 27.3807 0.059849


Week In Volatility

Volatility indexes fell around the world, and futures traded comparably lower. In Russia RTSVX fell on post-election non-event, and exchange holiday on the 8-9. Recently listed VHSI futures traded 84 contracts, and VXEWZ traded almost 300. I don't have volume data for VNKY futures, but looking at the term structure it looks like may expiration contract is overpriced compared to others - and this did not go away as the contract settled on Monday at 22.70. Is there an event being priced in the market?


More Volatility Data

As number of volatility indexes and volatility-linked instruments is growing every day I add them to the blog. Now because of the increase in data I decided to break it up into 3 separate pages:

Volatility Indexes contains all major country volatility indexes, non-equity indexes for commodities as well as swaptions and US treasury options -based volatility indexes, special strategy indexes including implied correlation indexes from CBOE, as well as many other specialized regional indexes and stock-based volatility indexes.

Volatility ETFs and ETNs has complete list of all volatility based exchange traded products around the world, including those based on VSTOXX futures. I expect this list to grow as volatility futures markets in Hong-Kong and Osaka mature.

Just today I added another page specifically for currencies. I am not sure what this page is going to be, but I will be adding data, and will see what will come out of it.

The list of indexes and ETPs is really meant to identify all volatility indexes and instruments; if you see that I am missing something please send me an email. 

Calculating VIX - like Indexes In Excel

There are two excellent resources on creating your own spreadsheet for calculating VIX or VIX-like volatility index for your product of choice:

1 "Calculating the VIX in Excel" by Tom Arnold and John H. Earl, available for free download from SSRN.

2  Derivatives: Markets, Valuation, and Risk Management (Wiley Finance) has step by step demonstration from Robert Whaley - the person who invented VIX! Book preview (with complete VIX calculation instructions) is available from google books (Appendix 15A)

Weekly market report

Wall st delivered a mixed bag of news with VIX, VNKY, and VSTOXX and their underlying markets almost unchanged. VXD - volatility index based...