VIX Expiration

VIX setteled this morning surprisingly high, at 18.02, up 3.16 since previous expiration. This value was higher than 16.51 I forecasted a month ago. VSTOXX closed at 22.36, also higher than my forecast of 20.60. It seems that short-term options premiums have collapsed too much, and market corrected up to the current levels. My forecasts for the next VIX expiration, June 15th, 2011 are
  • VIX at 18.83 vs 18.70 in futures
  • VSTOXX at 23.63 vs 23.75 in futures


This is the first expiration for GVZ at 18.79. The volume remains very light - May futures had total volume of 31 and open interest of 24 contracts. Open interest in May options is 35 contracts. I will not be forecasting GVZ this time.

Week in Volatility

In the equities market it was another relatively quite week with major indexes almost unchanged. Volume in GVZ options this week was only 4 contracts. That does not look good for the product. As I mentioned last week with volatility this low I remain mostly on the sidelines, having drastically reduced all my positions. I don't trade silver, but I think that there interesting opportunities in volatility for SLV, AGQ, and DBS.


Commodities Volatility

Everyone is talking about recent spike in commodities volatility, some even going as far as to call it commodities crash. I calculated 30 day interpolated ATM IV for different commodity ETF, and it seems to me that it is only SLV is that is the outlier, USO vol spike is coincidental, and other commodities just have elevated volatility but not out of the norm. See for yourself.


SLV - silver
USO - oil
GLD - gold
UNG - natural gas
DBA - agricultural commodities basket holding coffee, cattle, cocoa, and sugar futures
JJC - copper
CORN - you should be able to guess this one

See more commodity volatility indexes here.

A Useful Risk Index

Recently CBOE introduced SKEW index which many sources have covered and explained extensively. Despite being dubbed Black Swan index and Tail index, values of SKEW index defy simple interpretation. In what follows I hope to construct a simple and intuitive measure of risk that incorporates the same information as the SKEW.

The idea for measure is not mine; credit for inspiration belongs to Mark Sebastian from Optionspit who few weeks ago proposed an index that he called CBOP. CBOP was (originally) defined as CBOP = VIX * SKEW / 100. The index is intended to be a more complete measure of downside risk of the SPX index. By construction CBOP is increasing with both VIX and SKEW. If implied skew from the options is zero – SKEW index equals 100, and CBOP equals to the VIX, signifying no “additional” risk on the downside.

The problem with CBOP that it suffers from arbitrary construction – for example an alternative way to construct an index with the same qualities could have been VIX + SKEW – 100, or infinitely many other ways. The second problem is that it is only comparable to to its own time series, and does not have the same mathematical “meaning” as the VIX.

The solve these two issues I propose to expand on the idea of the VIX with so-called downside VIX, or put VIX, and upside VIX, or call VIX. VIX is defined as standard deviation of returns, or square root of variance, or √(E[R2]). Similarly call VIX and put VIX defined as √(E[R2|R>0]) and √(E[R2|R<0]) or standard deviation condition on return being positive or returns being negative. Just like VIX index corresponds to the value of variance swap, put VIX and call VIX correspond to values of weighted variance swaps, namely down variance swap and up variance swap.

These “partial” risk measures are not original in any way, for example Sortino ratio uses downside volatility in denominator, which is realized analogue to PUT VIX. Again, nothing above is original research, I’m just proposing to use a simple intuitive and existing concept instead of a new one.

Calculating these new indexes is trivial. VIX is calculated as weighted sum of OTM calls and puts, so by definition it contains call VIX (using only calls) and put VIX (using only puts). Please note that VIX contains an adjustment term that converts lowest call (that is ITM) to OTM put. I believe that calculating these indexes in real-time and also providing historical back-calculations should be really easy for CBOE. And as I mentioned before these indexes contain the same information as SKEW index.

But for illustration purposes I created a numerical approximation for these indexes. VIX and SKEW indexes are back-calculated from 1990 and provide information on the second and third moments. Non-zero skew imposes a lower bound on kurtosis, and these can be parametrized with normal inverse gaussian distribution. Then I calculate up-variance and down variance with numerical integration, so its all very straight-forward.


The image above shows the time-series of put VIX (highest line in light blue), VIX - middle, and call VIX (lowest line in dark blue) . The effect of skew is obvious, for example during 2008 VIX topped at 80, which put VIX showed higher number at over 90. Below is the YTD plot of indexes. Raw data is available here.


As I mentioned before, the numbers are intuitive - for example the latest set of numbers is:
call VIX = 14.66, VIX = 18.40, and put VIX 21.50. We can infer that market expects upside volatility of about 15%, but downside volatility of 22%.

Using New Volatility Products

EDIT: This event has been moved to May 27th 26th!

There is a meetup event in New York tomorrow focused on volatility ETFs. I have never attended these events, but this one looks really interesting and I'm going. 7 pm, ISE buiding at 60 Broad St., 26th floor New York, NY

From the event's description:

“It is no longer a VIX centric universe. Large banks are pushing vol products that are trying to capture the attention of options traders. Those products include VXX, VXZ, XXV, Volatility SKEW index, and others. How can we use them?”

Mixture of Normal, Formulas for Skew and Kurtosis

Mixture of normal distributions is a simple and intuitive way to create distributions with skew and kurtosis by mixing or adding two or more normal distributions. These are well known formulas, but for some reason every time I need to use them I have trouble locating them. So here they are for everyone's reference.

Define cdf and pdf as:


Then moments of x are:


Source: Modeling and Generating Daily Changes in Market Variables Using A Multivariate Mixture of Normal Distributions. My special thanks to Dr. Jin Wang for his correction to the skew formula.

Week in Volatility

This was a very boring week for equity indexes, with volatility practically unchanged for VIX and VSTOXX. My trading account is practically flat now because of all the volatility that I bought back. However gold rose 3% for the week, pushing GVZ from 15.70 last week to 20.25 on Friday, its highest closing value this year. Futures rose over 2 points, and implied volatility in GVZ contracts rose as well. As guys in Options Pit explained here, unlike VIX that has negative correlation with SPX levels, GVZ having both call and put skew could rise with the GLD, just like we saw this week. GV futures traded 27 contracts this week, and options traded 38.


Weekly market report

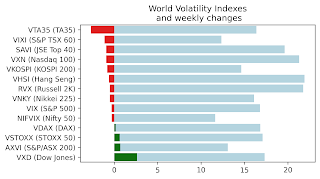
Wall st delivered a mixed bag of news with VIX, VNKY, and VSTOXX and their underlying markets almost unchanged. VXD - volatility index based...