I think that is really the question to ask after VZZ dropped below $10, triggering automatic termination. The prime suspect is TVIZ index that is also a 2 X version of Mid-Term VIX Futures Index, although unlike VZZ it is rebalanced daily. While VZZ is (was) issued by Barclays, TVIZ is from VelocityShares (Credit Suisse). I searched for any info on termination in the prospectus and product page, but could not find an automatic termination clause (Note that all VelocityShares ETFs share the same prospectus)
Vance at Six Figure Investing already covered the topic of termination in great detail on IVO and XIV ETFs. The only thing that I may add is that looking at the list of volatility-related products it does not appear that any of them are in the immediate danger of termination. VelocityShares are rebalanced daily and do not seem to include automatic termination clause. Short volatility ETFs that do have "acceleration" are probably safe, unless we see a major major market disruption event.

VZZ Terminated
Falling volatility caused VZZ ETF, which provides double leveraged (since inception, not daily) returns of VIX Mid-Term Futures Index, to fall below $10, causing automatic termination. As Barclays writes (note, prospectus)
"As a result of the occurrence of an automatic termination event on July 1, 2011 Barclays Bank PLC will automatically redeem its iPath Long Enhanced S&P 500 VIX Mid-Term Futures ETNs. The ETNs will be redeemed (in whole, but not in part) on July 11, 2011, the date which is five business days after the automatic termination date, and the payment upon redemption will be a cash payment equal to the closing indicative note value on the July 1, 2011, representing the automatic redemption value as described in this pricing supplement. The automatic redemption value shall not be greater $10.00 for each ETN and shall not be less than $0 per ETN."
VZZ has mostly accurately tracked the 2 X performance of VXZ, falling 67.35% since its first close vs 33.70% for VXZ. S&P 500 rose over 11% over the same time period.
"As a result of the occurrence of an automatic termination event on July 1, 2011 Barclays Bank PLC will automatically redeem its iPath Long Enhanced S&P 500 VIX Mid-Term Futures ETNs. The ETNs will be redeemed (in whole, but not in part) on July 11, 2011, the date which is five business days after the automatic termination date, and the payment upon redemption will be a cash payment equal to the closing indicative note value on the July 1, 2011, representing the automatic redemption value as described in this pricing supplement. The automatic redemption value shall not be greater $10.00 for each ETN and shall not be less than $0 per ETN."
VZZ has mostly accurately tracked the 2 X performance of VXZ, falling 67.35% since its first close vs 33.70% for VXZ. S&P 500 rose over 11% over the same time period.
Negative SPX/VIX Correlation, Predictor or Not?
Economist Eric Falkenstein, whose blog I follow religiously has a post about correlation between SPX and VIX. He writes that this correlation "...seems mainly a contemporaneous pattern applied to changes in volatility, spilled milk as opposed to a predictor. Think about when volatility was rising in 2008, and prices were falling simultaneously. The rise in volatility was not predicting price moves, just reflecting them, and the high volatility correlated with both the big move down and the big rebound in the latter part of 2009. " He addresses findings from another researcher, and there are interesting points raised in comments. In my own trading I do not use VIX, implied volatility, realized volatility or volatility forecast as indicator of market direction, because of their poor forecasting ability. See also my previous post on SPX/VIX correlation.
XIV - Your Questions Answered
I received a number of follow-up question to the XIV post. While I cannot share the data for the underlying index (per data subscription agreement) I'll explain the methodology in detail. Here is the sample spreadsheet that you should reference.
Sheet1 has four numerical columns, everything is done in google docs - so all this is very basic. The first contains values for SPVXSP index, which is the underlying index for VXX but without the costs and interest. Their effect is minimal in comparison to volatility of underlying index.
The values for SPVXSP index are in 90K range, that is because the starting value of the index is 100K. It is just a number and really does not matter that is it unusually high. In the second column I calculate simple returns for the index, third I calculate the inverse return by multiplying return by negative one. In the last column I apply inverse returns to get prices, with starting value equals $100. Again, all is very basic.
The table of monthly returns for the simulated index are on Sheet2. You may notice a large difference between simulation and actual XIV performance in the first month - that is only because the dates are different, and actual XIV has one less day than simulated version.
How risky is XIV? I apply bootstrap to monthly returns to find that there is about 60% chance that XIV will be up after one year, and 20% chance that it will more than double in price. This is of course contingent on previous return distribution to be true in the future, which we have no way of knowing. These results are of course excellent. On the downside there is about 12% chance of losing more than 50%, and expected maximum drawdown is 37%.
Sheet1 has four numerical columns, everything is done in google docs - so all this is very basic. The first contains values for SPVXSP index, which is the underlying index for VXX but without the costs and interest. Their effect is minimal in comparison to volatility of underlying index.
The values for SPVXSP index are in 90K range, that is because the starting value of the index is 100K. It is just a number and really does not matter that is it unusually high. In the second column I calculate simple returns for the index, third I calculate the inverse return by multiplying return by negative one. In the last column I apply inverse returns to get prices, with starting value equals $100. Again, all is very basic.
The table of monthly returns for the simulated index are on Sheet2. You may notice a large difference between simulation and actual XIV performance in the first month - that is only because the dates are different, and actual XIV has one less day than simulated version.
How risky is XIV? I apply bootstrap to monthly returns to find that there is about 60% chance that XIV will be up after one year, and 20% chance that it will more than double in price. This is of course contingent on previous return distribution to be true in the future, which we have no way of knowing. These results are of course excellent. On the downside there is about 12% chance of losing more than 50%, and expected maximum drawdown is 37%.
What is surprising to me is that return distribution is clearly positively skewed despite being a short-vol strategy. If you have any thoughts on this, please share or leave a comment.
Now let me clarify even though I think that XIV is a good product I don't plan on investing in it, because I think for me as a full-time trader it is far better to trade and actively manage risk than it is to buy and hold. You should decide for yourself if the product fits your investment objectives and risk tolerance.
Now let me clarify even though I think that XIV is a good product I don't plan on investing in it, because I think for me as a full-time trader it is far better to trade and actively manage risk than it is to buy and hold. You should decide for yourself if the product fits your investment objectives and risk tolerance.
Interesting VIX article
This one is Merrill Lynch guide to VIX futures and options, a research note that dates to December 2008, right after the credit crisis. Although dated, it contains a lot of info that I have not seen elsewhere. There is a very thorough introduction to empirical properties of the VIX (in the appendix), such as negative nonlinear correlation with SPX, and nonlinear "premium" of long-term futures contracts over short-term once, as well as relationship between short and long-term futures.
The main part of the document has an excellent exposition of different alpha strategies in VIX derivatives, as well as comparison to CBOE strategies indexes VPD and VPN. Over the testing period " Short VIX derivative positions would have offered higher returns and lower risk than the S&P 500. Despite the significant spike in volatility over the backtesting period, the returns of the short futures (-5.4%), short calls (2.0%), and short capped futures strategies (-3.8%) were all higher than the S&P 500 (-12.0%) ... All three strategies had nearly half the risk of the S&P 500 (25.6%), varying between 9.2% and 13.6% "
The main part of the document has an excellent exposition of different alpha strategies in VIX derivatives, as well as comparison to CBOE strategies indexes VPD and VPN. Over the testing period " Short VIX derivative positions would have offered higher returns and lower risk than the S&P 500. Despite the significant spike in volatility over the backtesting period, the returns of the short futures (-5.4%), short calls (2.0%), and short capped futures strategies (-3.8%) were all higher than the S&P 500 (-12.0%) ... All three strategies had nearly half the risk of the S&P 500 (25.6%), varying between 9.2% and 13.6% "
World Map of Volatility, Updated
Single Country Volatility Indexes (+Bloomberg Codes)
CITJTVIX:IND - Taiwan Volatility Index, one of the Asian volatility indexes developed by citigroup
INVIXN:IND - India VIX
RTSVX:IND - Russian Volatility Index
SAVIT40:IND - South Africa Volatility Index
SPAVIX:IND - Australia, also known as XVI. As I blogged earlier ASX has concrete plans to launch futures on the index
V1X:IND - Germany, also known as VDAX
V3X:IND - Switzeland, also known as VSMI
VAEX:IND - Netherlands
VBEL:IND - Belgium, has no data since November of last year, appears to be discontinued
VCAC:IND - France
VFTSE:IND - United Kingdom
VIMEX:IND - Mexico Volatility Index based on IPC, unlike others this is a 3 month index
VIX:IND - United States
VIXC:IND - Canada
VKOSPI:IND - Korea
VNKY:IND - Japan, Nikkei Volatility Index. There is also VXJ:IND but it is being updated every two weeks; VNKY is updated daily
VHSI:IND - Hong Kong, HSI Volatility Index. There is also ASCNCHIX:IND which averages implied volatilities of HSI options and FXI ETF options, so it is not a "pure" HK volatility as FXI also has currency risk. At this point there is no mainland China volatility index, since there are no listed options on A-shares.
VXEWZ:IND - one of the new CBOE volatility indexes based on ETFs, this one measures implied volatility of EWZ ETF. Unfortunately there does not seem to be any other Brazil volatility index at this time. Can Bovespa get its own vol index?
VIX Expiration and Forecasts
VIX settled this morning at 19.73, up 1.71 from May. VSTOXX closed at 23.23, up 0.87. Overall despite low volatility levels high economic uncertainly is priced in skew and term structure. My own forecasts for the next expiration are


Volatility forecasting contest that I announced few weeks ago is now closed. I was hoping for a better response, but I guess readers just afraid to be spammed. Still, I'm happy this way it turned out to be a close-knit group of readers. The forecasts range from 13.50 to 25.12, with average value of 18.12, and median value of 17.01. Using bootstrap I calculated the confidence of 0.70 (1 std) on the forecast, which is much much smaller than anything one would get by a statistical technique! (See the bootstrap of the forecasts below) I'm surprised that most of you emailed forecasts with cents component, as opposed to rounded to a dollar, which to me is an indirect evidence that people really put thought into their forecasts. Good luck, traders, and hedge your deltas!

- VIX at 19.71 vs 19.20 in futures
- VSTOXX at 22.79 vs 22.40 in futures


Volatility forecasting contest that I announced few weeks ago is now closed. I was hoping for a better response, but I guess readers just afraid to be spammed. Still, I'm happy this way it turned out to be a close-knit group of readers. The forecasts range from 13.50 to 25.12, with average value of 18.12, and median value of 17.01. Using bootstrap I calculated the confidence of 0.70 (1 std) on the forecast, which is much much smaller than anything one would get by a statistical technique! (See the bootstrap of the forecasts below) I'm surprised that most of you emailed forecasts with cents component, as opposed to rounded to a dollar, which to me is an indirect evidence that people really put thought into their forecasts. Good luck, traders, and hedge your deltas!

Subscribe to:
Posts (Atom)
Weekly market report
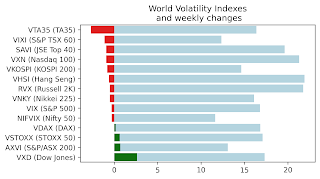
Wall st delivered a mixed bag of news with VIX, VNKY, and VSTOXX and their underlying markets almost unchanged. VXD - volatility index based...
-
 If you're working with daily data (without access to intraday data) and need to calculate volatility, then using close-to-close squared ...
-
As I am sure all of you know Russia has began a full scale war against my home country Ukraine. Please make no mistake - Putin's goal ...
-
VIX expiration day often coincides with particularly heavy trading activity in underlying SPX options. VIX settlement value, or VRO rarely m...
