VSTOXX is the second most popular volatility contracts after VIX. Eurex lists two more options months than CBOE - September and November, however there was no trading activity in these contracts in the past week. VSTOXX front month futures ended the week exactly where they started - at 18.90, and near months ATM volatility rose, which is a typical behavior for volatility options.

Week In Volatility: CBOE Options - 2/23/2013
Volatility markets rose last week, VIX rose 1.51 from 12.66 to 14.17, VSTOXX gained 2.01 from 18.85 to 20.86. In this report I will focus on CBOE volatility options. VIX is the volume leader; volume in other indexes are four orders of magnitude smaller:
VIX 3,469,078
OVX 594
GVZ 359
VXEEM 339
VXEWZ 20
In comparison VSTOXX options traded 101,626 contracts last week.
As vol options generally have positive skew, when futures rise so does ATM implied volatility. At the same time when futures remain unchanged volatility tends to rise toward expiration. As we will get closer to expiration ATM IV in the front month will tend to about 100%.
I do not provide volatility charts for other futures - the data is too sparse and irregular to make sense. Below is the chart of front month skew for VIX options. Next time I will publish charts for VSTOXX options skews.
I do not provide volatility charts for other futures - the data is too sparse and irregular to make sense. Below is the chart of front month skew for VIX options. Next time I will publish charts for VSTOXX options skews.
Week In Volatility: International Indexes - 2/16/2013
VSTOXX - the most liquid of volatility futures outside US was practically unchanged over the last week. Hong-Kong markets were closed to trading most of the week for the New Year celebrations (and 新年快乐 to Chinese-speaking readers of this blog) which resulted in abysmally small volume. Nikkei volatility futures are the only market that is in contango right now - not surprising since VNKY was on the rise since December of last year. Unfortunately I don't have information in liquidity, volume, or bid-ask spreads, but or someone who has access to the market VNKY right now provides interesting trading opportunities.
VIX, VSTOXX etc. March 2013 Forecasts
EDIT 2/18/2013: Below I stated incorrect closing value for VSTOXX. The correct value is 18.28. I will update volatility tracker spreadsheet with the correct value.
Last month I made forecasts for VIX and VSTOXX indexes, and the results are in - VIX settled at 13.07 (VRO) while EuroStoxx Volatility Index closed on Wednesday at 18.37 My forecasts did not do so well from statistical perspective (vs futures: worse in points, better in %). As usual, all are logged in the forecasts tracker spreadsheet.
My forecasts for the next expiration - March 20th 2013 are listed below - now for all CBOE volatility futures. Forecasts are logged now; but futures prices will be updated later because my data provider has not updated them yet.
VIX @ 12.49 vs 14.75 in futures market
VSTOXX @ 16.43 vs 18.70
GVZ @ 13.19 vs 15.95
VXEEM @ 15.90 vs 18.70
VXEWZ @ 17.01vs 19.65
OVX @ 20.15 vs 23.00
VXN @ 13.53 vs 16.00


My forecasts for the next expiration - March 20th 2013 are listed below - now for all CBOE volatility futures. Forecasts are logged now; but futures prices will be updated later because my data provider has not updated them yet.
VIX @ 12.49 vs 14.75 in futures market
VSTOXX @ 16.43 vs 18.70
GVZ @ 13.19 vs 15.95
VXEEM @ 15.90 vs 18.70
VXEWZ @ 17.01vs 19.65
OVX @ 20.15 vs 23.00
VXN @ 13.53 vs 16.00
Week In Volatility, 2/9/2013
In the US markets remained flat over the last week, and most of the major volatility indexes ended the week pretty much where started. VIX rose 0.12, and other CBOE indexes moved less than 1, with futures term structure largely unchanged.
Internationally there was some movement - VSTOXX gained 2.57, and VNKY continued its upward trend gaining 4.37 over the week.
Internationally there was some movement - VSTOXX gained 2.57, and VNKY continued its upward trend gaining 4.37 over the week.
Taiwan Volatility Index

Below is the chart of recent performance of Asian volatility indexes - Taiwan VIX is very close to VHSI (volatility index of Hong-Kong) which is not surprising. With the exception of VNKY (Japan) all indexes have been in slow decline over the last few months.

I could not find bloomberg ticker for the new index, if anyone knows please email me.
RTSVX Forecast
RTSVX front month futures expired today (they expire toward the beginning of the month) so it is time to forecast next expiration. My model predicts RTSVX to close at 18.97 vs March futures at 25.85. This is a significant discount, even lower than the current value of the Russian Volatility Index at 19.95. As usual all forecasts are tracked monthly at forecasts tracker spreasheet. Now that I am tracking all tradable volatility indexes it is easy to see that the model is decidedly bearish on the volatility, although these forecasts are not for speculation, but purely to track forecasting accuracy of my volatility model in different markets.
P.S. I have updated Volatility Publications page with few gems: first latest from Christopher Cole titled Japan's Attempted Reflation, second an old publication from excellent team at Barclays titled Valuing Vol of Vol, and last but not least a publication from GS titled VIX regimes over the last 23 years. I wrote about VIX regimes back in September 2010 where I identified 3 VIX regimes, but GS team used a very different methods for their analysis. I am planning a follow up post on volatility regimes using more recent data.

P.S. I have updated Volatility Publications page with few gems: first latest from Christopher Cole titled Japan's Attempted Reflation, second an old publication from excellent team at Barclays titled Valuing Vol of Vol, and last but not least a publication from GS titled VIX regimes over the last 23 years. I wrote about VIX regimes back in September 2010 where I identified 3 VIX regimes, but GS team used a very different methods for their analysis. I am planning a follow up post on volatility regimes using more recent data.
Subscribe to:
Posts (Atom)
Weekly market report
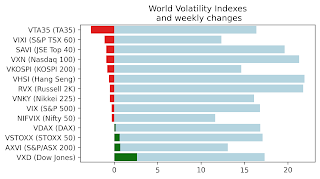
Wall st delivered a mixed bag of news with VIX, VNKY, and VSTOXX and their underlying markets almost unchanged. VXD - volatility index based...
-
 If you're working with daily data (without access to intraday data) and need to calculate volatility, then using close-to-close squared ...
 -
John “Hojun” Hwang is the author of VIX, VIX Futures, and VIX ETNs, a conceptual guide to trading the VIX index. He graduated with degrees i...
-
As I am sure all of you know Russia has began a full scale war against my home country Ukraine. Please make no mistake - Putin's goal ...
