Nikkei Volatility Index April 2013 Forecast

Nikkei Volatility Index has been in the uptrend over the last few months while the rest of the world volatility indexes have been in the decline. As I hear the increased volatility worked well for quant-funds trading Japanese equities, but it is a risky currency environment given the rise of USDJPY volatility (although USDJPY skew has declined from its highs.


This is my first forecast for VNKY - to expire at 25.07 vs futures price 24.40 . Currently this is the only forecast for a volatility index to rise - if you look at the chart there is significant upside potential for the index. With VNKY closing at 25.13 I calculate there is 14% chance that it will expire higher that 30.00 .As always, all forecasts are logged at forecasts tracker spreasheet.


Week In Volatility

Volatility News:

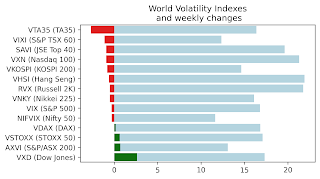
Equity markets up, volatility indexes down -  no need to regurgitate old news, just summarize the stats: VIX fell 2.77 , VSTOXX  lost 4.39, VNKY is the only index that has gained 0.13 - I am planning a post analyzing the complete divergence of VNKY from other vol indexes... Speaking of  Technical glitch created bad price for Nikkei Volatility Index on Mar 4th

Two books coming out in the second edition: Volatility Trading by Euan Sinclair and Inside the Black Box by Rishi Narang. I wrote before about Volatility Trading; Rishi Narang's book is not volatility focused but covers quantitative strategies in detail, and specifically explains how strategies interact, and under which circumstances they succeed or fail, what quantitative strategies can accomplish and what they cannot. It is a straight-forward non quantitative book that is meant to provide an overview of quant trading ecosystem without technical jargon.


RTSVX April 2013 Forecast

RTSVX - Russian Volatility Index closed on Thursday at 20.31. The value was significantly closer to my forecast of 18.97 than to 25.85 - the futures value at the time of forecast, and also my forecast was correct on the direction capturing a healthy difference of 5.54. However my recent analysis shows that RTSVX is one of the more volatile indexes and one of least predictable, and I am curious how accurate the forecasts will turn out for the rest of the year.

My forecast for the April expiration for RTSVX to close at 20.00 vs futures value of 25.60. The model is still bearish on volatility throughout the world, but I certainly advise against outright trades. As usual all forecasts are tracked monthly at forecasts tracker spreasheet.


VIX is to SPX as VVIX is to ?

The answers seems obvious - VIX is the 30-day volatility of SPX, VVIX is the 30-day volatility of VIX, but in reality it is a little more complicated than that, as least when it comes to the difference between historical and implied volatility, or volatility risk premium. After discussing this with one of the readers I decided to make this a short post.

VIX measures 30-day implied volatility of SPX options, and is a (granted, biased) predictor of future 30-day historical volatility of SPX index. However this same is not true for VVIX, that is VVIX is not a predictor of future 30-day historical volatility of VIX. It is however a predictor of future 30-day historical volatility of 30-day VIX forward. Such instrument does not exist, but the next best thing is VXX - ETF that holds front and second month futures to approximate returns on 30-day forward.

Something to note that theoretically term structure of implied volatility of VIX is decreasing with time to expiration, but VXX has a flat term structure, corresponding (approximately) to 30-day VIX implied volatility.


Forecast Volatility with Skew

I came across a research paper "Corridor Volatility Risk and Expected Returns" the other day. To summarize in one sentence researchers construct volatility indexes using a subsets of SPX options, e.g. call VIX or put VIX, and find that equity risk premium is correlated to call VIX, not put VIX.

That gave me an idea to check the same on volatility risk premium - or alternatively figure out a better way to forecast future realized volatility using skew information. I regressed VIX on following 22-day realized volatility ( beta ~ 0.75 ) and tried to correlate residuals to CBOE SKEW Index (and couple of different transformations of SKEW Index).

Result: nothing; I did not find any way to improve volatility forecasts using SKEW. I don't know if there is really no relationship - I suspect that there is one, and I just failed to figure it out. If you have more success that me, please send an email.

Poland's Volatility Index

Index options based on Polish WIG 20 Index started trading in September 2003, and since then the market has matured to the point that one can develop a volatility index. The Warsaw Stock Exchange does not publish an ‘official’ volatility index, so I decided to create one and publish the data.


POLAND_VOLATILITY_INDEX.csv in US format (02/28/2013,2452.01,16.36)
POLAND_VOLATILITY_INDEX_EUR.csv in European format (28/02/2013;2452,01;16,36)
Everyone is permitted to copy and distribute this file as long as you cite the original source.

Construction:

There is one academic work, ‘Emerging versus Developed Volatility Indexes’ by Slepaczuk and Zakrzewski, which does address a WIG20 volatilty index, however the authors do not provide data for their index and differ substantially in methodology from my own.

I teamed up with Grant Shannon – personal friend and one of the creators of South-African Volatility Index to crunch the numbers. We followed the original VIX Whaley (1993) methodology – basing the index on most liquid ATM options, instead of the Derman et al (1999) methodology because the skew information is not particularly informative: 2012 is the sole year that the exchange listed more than 30 strikes per expiration, and option volumes actually declined from the year before.

Most of the OTM options don’t trade, or trade very little – so a volatility index based on OTM options would not be robust. This is in contrast to Slepaczuk’s paper that used the Derman methodology, but had to create significant modifications to make it work for the Polish market. Using Whaley’s methodology also allowed us to create a 30-day index, just like the VIX. We believe this is also an important advantage over Slepaczuk’s 91-day index since liquidity is concentrated in near term options. Also 30-day index allows for direct comparison with other international volatility indexes like VIX, VSTOXX and others.

Grand Shannon specifically noted that emerging market volatility indices typically do not trade, i.e. they are built more for information and risk management purposes than for trading. This is a critical point because it means that there is no need to build an index that has skew built into it; a simpler model would work for emerging markets such as Poland - at the money volatility is transparent and sufficient as a starting point for risk management. The index also would be accurate as ATM implied volatility data is much more readily available in most emerging markets. In addition, an ATM implied volatility index is much more understandable too - as opposed to one that includes skew.

We calculated the index from inception on September 22, 2003 to present. By the end of the week I plan to start updating the spreadsheet daily with most recent index values.


Application:

My efforts to create this new series are aimed at assisting empirical researchers and interested market participants in gaining new insights into the emerging volatility space. One interesting application of the new index includes an analysis of the recent world-wide volatility spike of August 2011. On August 4th Jose Manuel Barroso, the head of the European Commission warned that the eurozone debt crisis was spreading from the smaller debt-laden nations to Italy and Spain. Italian and Spanish yields rose sharply while German yields fell. On the evening of August 5th after close of trading, S&P downgraded credit rating on USA.


During the first week of August WIG20 fell from 2726.31 to 2447.21 and the WIG20 Volatility Index more than doubled from 13.36 to 35.27. On Monday August 8th most of the indexes experienced a free-fall: Euro Stoxx 50 declined 3.7%, S&P 500 declined 6.7%. ECB launched a massive buying program of Italian and Spanish debt. Volatility rose across Europe; the VIX jumped from 32 on Friday to 48 on Monday’s close where it topped out. Wednesday 10th seems to be the worst day – WIG20 fell 5% - it’s 8th consecutive down day while the WIG20 Volatility Index reached 57.74.

VHSI Forecast

Last month I made a VHSI forecast that the index will close at 12.98. My forecast was substantially off - the index finished much closer to the futures value, but still finished lower than when we started. As every month, all forecasts are logged in the spreadsheet where I track all values.

My forecast for March 28, 2013 expiration - for VHSI to finish at 13.92 vs futures at 16.00. My model is definitely bearish on vol world-wide.


Weekly market report

Wall st delivered a mixed bag of news with VIX, VNKY, and VSTOXX and their underlying markets almost unchanged. VXD - volatility index based...