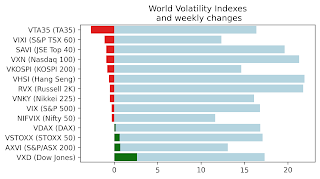
Volatility of Average

Different commodity including some volatility and bitcoin futures settle to an average value. For example VSTOXX settles to 1 minute sampled average value of the index in the last half hour of trading, Bitmex XBT/USD futures settle to 1 minute sampled average value of the last two hours of trading, Atlas ATS BTC/USD futures and options settle to a 24 hour average of the last calendar day of the month.
Correct modelling of this is interesting for both options and futures pricing, as average process has obviously less volatility than "regular" process. How much less? Well, apparently I fell asleep during a class because I have no recollection of the formula until I recently researched it.
B(t) is ABM, then has variance of


In simple terms, average has 1/sqrt(3), or about 58% of volatility. 

Simple example: assume BTC/USD volatility of 100% per year. Expected volatility over 30 days should be  sqrt(100 * 100 * 30/365)  = 28.67%. However if the contract settles to the last day's average, for options pricing we should use volatility of sqrt(100 * 100 * 29/365 + 100 * 100 * 1/365 / 3)  = 28.35%, slightly lower. 

In conclusion: average settlement - interesting, but of little practical importance from pricing perspective. 

P.S. Re: Atlas ATS - could not get their API to work, waiting for LedgeX. 

Updated Expiration Calendar

Happy New 2015 to volatility traders everywhere! I have updated Expiration Calendar with expiration dates for all listed volatility futures in the world. What is new since the last update? Well, several things:

1 - Eurex added Variance Futures on Eurostoxx 50 Index (EVAR). Cannot say I'm excited about the product - CBOE tried to list variance futures twice without success.
2 - India VIX, weekly expirations on Tuesdays, 3 contracts listed at the time. Not sure who decided that NSE India needs weekly volatility contracts, instead of regular monthly contracts, like everything else on the exchange.
3 - Australia VIX, sadly the product did not attract much volume either. If I understand correctly, exchange's expiration calendar does not include expiration dates for AVIX, and I calculated them myself.
4 - Korea. After years of teasing, KRX finally listed VKOSPI futures last November. Volume is still low, but I hope that some of the KOSPI options liquidity will spill over to VKOSPI. Overall KRX seems to be on the product expansion mode. As FT reported yesterday the exchange "unveiled a 10-point plan to revive trading in Seoul, unveiling measures to relax daily price limits in its stock markets, introduce market making schemes for illiquid stocks and exempt derivatives market makers from a local transactions tax."

Dispersion Trading

Recent video from Tasty Trade on volatility dispersion trading. I think they quite downplayed the complexity of the trade, they don't mention proper weighting design to achieve either correlation or covariance mispricing, and their delta-based approach makes sense only for ITM options.

Other correlation resources:
Fundamental Relationship Between An Index's Volatility And The Correlation And Average Volatility Of Its Components, by Sebastien Bossu, Yi Gu
Dispersion Trading in German Option Market, by Jonas Lisauskas
Studying the Properties of the Correlation Trades, by Cayetano Gea Carrasco
Analysis and Development Of Correlation Arbitrage Strategies on Equities, Yujin Chloe Choi
and best for the last  Dispersion Trading Reading List, from condoroptions.com


Weekly Options Selling, and Time-Risk Blindness

I would like to start today's post with a quote from a recent article discussing risk of earthquakes:

Even if we can comprehend a 30-percent chance of rain, or near-term odds like a coin flip, low-probability events are different. They have a “bewildering” effect on people, says Howard Rachlin, a professor emeritus of psychology at Stony Brook University. So we tend to lump them together; 1 in 10,000 sounds just as bewildering as 1 in 100,000. This is why people buy lottery tickets, even though the likelihood of winning is outrageously less likely than an event like a big earthquake in a seismically active region.
“All low chances seem the same,” Rachlin says.
When it comes to living our lives today or making plans for next weekend, behaving as if low probability is essentially zero chance isn’t necessarily a bad thing. We would be paralyzed otherwise.
But stretch that low probability over time — which is how earthquake risk is estimated — and confusion with low probabilities morphs into complete incomprehension. If you live in an earthquake-prone place for 10,000 days, the cumulative probability gets higher and higher, approaching 1 in 1. Our minds, unfortunately, have a hard time keeping up.
“We don’t see how these small things add up when you do them over and over again,” says Fischhoff. In study after study—looking at compound interest, unsafe sex, driving without a seatbelt, floods, earthquakes — we underestimate such cumulative effects. It’s one of those cognitive shortcomings calling out for a name. Maybe it should be called something like time-risk blindness. From The Aftershocks by David Wolman.

Recently I have noticed a marked increase in the number of short volatility trading systems offered by vendors, and specifically trading strategies that sell weekly options. While short vol strategies have enjoyed certain popularity, they have grown (at least from what I see on the web) with increased liquidity and higher number of names in weekly options.

I will admit right away that I am not a fan of vendor strategies, especially in options, simply because disparate incentives between vendor and customer. Vendors usually charge fixed fees (usually monthly fees of $30-$100) for signals and recommendations that customer is supposed to execute in their own account. While vendor does not participate in the upside or downside of the trades they recommend, they cannot help but to want to keep their customers paying as long as possible. This is generally a good thing, but we should remember that these strategies are likely to be short-vol strategies - steady returns, low vol until vol spikes up.

This effect is particularly strong in weekly options, and I think is exacerbated by the time-risk blindness mentioned above. Vendors suggest profits of 1% per trade ( per week - 64% compounded after a year of trading ) implying approximately 1 in 100 "fair" chance of losing 100% of the account. Since 1 in 100 is 1 in 2 years of trading, this gives sufficient time for a vendor to build up a pretty chart and start collecting fees. This is also long enough for a client to start forming the time-risk blindness about real risks of the strategy.

In summary: please be extra careful about short-vol strategies with weekly options. It is very difficult to properly understand and appreciate the risks of such strategies.

VKOSPI Futures Update

According to a recent article in Risk magazine Korea's Financial Services Commission is planning to introduce volatility futures on VKOSPI index sometime before the end of the year. It has been for quite sometime in the planning stage ( I first wrote about it 2.5 years ago ) but the product may finally come to the market. Given lack of liquidity in other Asian volatility futures I am pessimistic about the product attracting volume.

Reliability of the Maximum Drawdown

I recently came across an old article titled Reliability of the Maximum Drawdown, and suggest that trades familiarize themselves with the ideas mentioned there. I would like to suggest an idea that may be a way forward.

The mathematics of maximum drawdown (expected maximum drawdown, and its distribution) are far from trivial, and many other related measures (for example expected length of drawdown) afaik have not been seriously studied at all.

The problem with max-measures, like mentioned in the article above, is that they are extreme measures, and thus are at the very corner of distribution charts. If you have a strategy that suffered a maximum drawdown of x% you know that such drawdown is possible, but if you observe another strategy with smaller drawdown, you can hardly be sure that it will not suffer from a greater drawdown in the future.

One possible way forward is to use "average measures" - average drawdown and average drawdown length instead of their max counterparts. Intuition suggests (and my extensive monte carlo confirms) that these measures have smaller variability,  smaller skewness, and more predictive (as measured by linear and nonlinear correlations) from one period to the next. These measures seem to scale linearly with time, with the scale coeffcient depending on kurtosis. I don't have the maths to take this much further on my own, but if you have some ideas please leave a comment or send me an email.

Weekly market report

Wall st delivered a mixed bag of news with VIX, VNKY, and VSTOXX and their underlying markets almost unchanged. VXD - volatility index based...