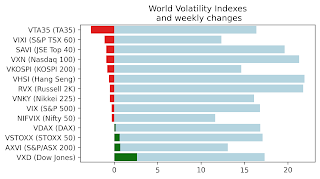
Markets fell this week, with S&P down almost 4% and STOXX falling 2.5%. VIX rose 4.5 points; Jan-11 up 2.1 points, Feb-11 up 1.7 points. The rise in long-term vol occurred overnight from Tue to Wed. STOXX did not fall as much as S&P, and rise in VSTOXX was also less pronounced - index up 2.26, and long-term futures up 1+ point.
What is really interesting is that while VIX and VSTOXX rose this week, other volatility indexes around the world fell. I did not have the time for thorough data analysis, but NSE India VIX index made an all-time low, closing at 16.74 on Fri, link. Keep in mind that the index was in existence for a relatively short time. I was able to put together two charts of Citi Asian volatility indexes (that have longer history than India VIX) and VIX.
Over the past five years most of Asian markets had higher implied volatility than the VIX.
However since the vol spike in May most Asian volatility indexes have declined much more than the VIX, closer to Apr low levels.
Part 1 here, part 3 here. Everyone knows that VIX futures (and ETFs) do not move one to one with the index. Given the complicated dynamics of the index - jumps, multiple regimes, mean-reversion - it is actually not surprising that replicating the index in a tradable instrument is not trivial. However there's very little info about quantifying the relationship.
In this excellent article surlytrader talks about imperfect correlation between VIX futures and the index, writing "... VIX futures become less correlated to the spot VIX index as you move further out in expirations. ... By investing further out on the curve, we do not capture as much of the movements of the VIX spot index. On the flip side, by investing further out on the curve, we lose less as the futures contract ages." Surlytrader also provides a plot with schematic depiction of correlation declining with time to maturity. In the plot he calls it VIX Beta, but I thought that VIX Delta would be more in line with the convention.
To explain the relationship I created an applet that quantifies and illustrates this dynamic relationship between futures prices, tenor, and correlation to the index. One of the most intuitive features is the effect of mean-reversion parameter on the price and delta. When mean reversion is large VIX futures converge quickly to their long-term level, and delta quickly decays toward 0. When mean-reversion is small (e.g. like it is in the stock market) then more familiar dynamics emerge - futures are "connected" to the index level, and correlation is high.
If you do not see the applet above you may need to download shockwave player from Adobe (same company that makes Flash player, and Pdf reader)
One of the practical applications of VIX futures delta is trading calendar spreads on VIX futures /options / ETFs, and measuring position risk.