Week in Volatility

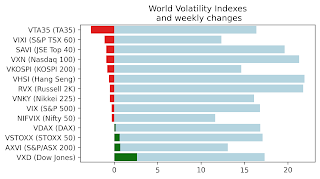
Markets fell this week, with S&P down almost 4% and STOXX falling 2.5%. VIX rose 4.5 points; Jan-11 up 2.1 points, Feb-11 up 1.7 points. The rise in long-term vol occurred overnight from Tue to Wed. STOXX did not fall as much as S&P, and rise in VSTOXX was also less pronounced - index up 2.26, and long-term futures up 1+ point.


What is really interesting is that while VIX and VSTOXX rose this week, other volatility indexes around the world fell. I did not have the time for thorough data analysis, but NSE India VIX index made an all-time low, closing at 16.74 on Fri, link. Keep in mind that the index was in existence for a relatively short time. I was able to put together two charts of Citi Asian volatility indexes (that have longer history than India VIX) and VIX.
Over the past five years most of Asian markets had higher implied volatility than the VIX.


However since the vol spike in May most Asian volatility indexes have declined much more than the VIX, closer to Apr low levels.

Understanding VIX Futures Movement, Part 3

Part 1 here, part 2 here. In the previous post I described decorrelation of VIX futures over time. In this post I will discuss the the decay, or theta of futures.

Surlytrader writes "Consider this the cost of holding the long position over time. This is important because we can think about VIX futures trades much like we think about calendar spreads in the options world. In a calendar spread you buy a longer dated option and sell a short dated option. You hope that the short-dated option decays (loses value) quicker than the long-dated option. In addition you hope that your purchased long-dated option covers you against adverse movements on the short position in the short-dated options. "

Indeed, VIX futures do behave like options. Unlike "regular" index futures, VIX futures are non-linear in the index. That means that besides delta VIX futures also have gamma and theta. The last one is the most obvious, and is indeed observed in the marketplace. As one can see, most of the price decay occurs closer to expiration. The applet below demonstrates VIX daily decay as a function of different parameters.


If you do not see the applet above you may need to download shockwave player from Adobe (same company that makes Flash player, and Pdf reader)

Understanding VIX Futures Movement, Part 2

Part 1 here, part 3 here. Everyone knows that VIX futures (and ETFs) do not move one to one with the index. Given the complicated dynamics of the index - jumps, multiple regimes, mean-reversion - it is actually not surprising that replicating the index in a tradable instrument is not trivial. However there's very little info about quantifying the relationship.

In this excellent article surlytrader talks about imperfect correlation between VIX futures and the index, writing "... VIX futures become less correlated to the spot VIX index as you move further out in expirations. ... By investing further out on the curve, we do not capture as much of the movements of the VIX spot index. On the flip side, by investing further out on the curve, we lose less as the futures contract ages." Surlytrader also provides a plot with schematic depiction of correlation declining with time to maturity. In the plot he calls it VIX Beta, but I thought that VIX Delta would be more in line with the convention.

To explain the relationship I created an applet that quantifies and illustrates this dynamic relationship between futures prices, tenor, and correlation to the index. One of the most intuitive features is the effect of mean-reversion parameter on the price and delta. When mean reversion is large VIX futures converge quickly to their long-term level, and delta quickly decays toward 0. When mean-reversion is small (e.g. like it is in the stock market) then more familiar dynamics emerge - futures are "connected" to the index level, and correlation is high.


If you do not see the applet above you may need to download shockwave player from Adobe (same company that makes Flash player, and Pdf reader)

One of the practical applications of VIX futures delta is trading calendar spreads on VIX futures /options / ETFs, and measuring position risk.

Week in Volatility

S&P and STOXX were up this week 1.8% and and 1.3% - pretty much non-event except for the roller-coaster on Friday. VIX and VSTOXX futures moved lower by about 0.75 points. Meanwhile I came across this article indicating that prices for long-term vol derivatives are historically very high. If anyone knows where I can get more data on this, please email me.


Like I wrote earlier the term-structure of VSTOXX futures is much flatter than VIX, and I believe it provides an excellent opportunity for relative trade.

Understanding VIX Futures Movement

This is the first post in the series; part 2 here, part 3 here. I recently came across this blog post from Lawrence McMillan:

"The advantage of buying, say, September VIX puts is that the huge 6.87 point differential between VIX and the Sept VIX futures will have to disappear by September VIX expiration (in eight weeks). Remember that the Sept VIX puts are priced off of the futures, not off of VIX. So, if that 6.87 differential shrinks by the September futures falling from their current price near 31 to the current VIX price near 24, those puts would profit handsomely."

He's right that the future is most likely to decline and meet the index than other way around, but his explanation is ambiguous. Considering mean-reversion effect by itself we should actually expect the opposite - VIX index wobbles around all over the place but eventually comes back to some steady level. So in our case we should expect VIX to rise up to the futures level. This is a valid hypothesis, however most of the time VIX futures display an upward slope, so mean reversion cannot be the only factor.

The explanation why VIX futures are most of the time higher than the VIX, is in convexity premium. The distribution of VIX levels is very right-skewed, and that skew demands premium. Every day that premium is getting smaller, and futures get cheaper. Meanwhile if VIX is below some level it will move up, if it is above that level it will move down. This interplay between mean-reversion and risk is what drives the complicated dynamics of VIX futures.

When I have more time I will try to post some charts, and more quantitative description of the dynamics.

On a separate note here is a very thorough VIX introduction from Mr McMillan.

VSXX - VSTOXX ETF Performance Very Different From VXX

Edit Dec 7, 2010: See my updated post on VSXX here.

VSXX, an ETF based on VSTOXX Short-Term Futures Index is trading for two months now (summary here, official Braclays page on VSXX is here, and here is the explanation of the index the ETF is based on). The VSTOXX futures trade in €, but as far as I understand European traders have two options as ETF trades in London in £, and in Germany in €. Below is the plot of VXX ($) vs VSXX (€)


I've read the description on both indexes and calculation algorithm seems to be the same for both. However the most interesting nugget of information is found in the summary on Deutsche Börse website here, page 5 figure 2. The chart compares performance of two volatility indexes - VIX and VSTOXX vs. their short-term futures indexes. The cost of carry, that eroded VIX futures index to about a third of its starting value in 4.5 years had almost no effect on VSTOXX - based index. Below I reproduce the charts from my data. SPVIXSTR is S&P 500 VIX Short-Term Futures Index, and VST1MT is Euro STOXX 50 Volatility Short-Term Futures Index.


I was going to type up some stats based on the data above, but picture's worth a thousand words. Over the last year and half VXX declined precipitously, however such decline is probably not in the cards for VSXX. While the term stucture of VIX futures is rather steep, making the roll costly, VSTOXX term structure appears to be relatively flat.

Honestly, I cannot say that I know the reason for that. One possible explanation is that I made a mistake , and there is a critical difference in the calculation of two indexes that escaped my attention. That seems unlikely, as Barclays' publication obviously implies that the indexes are comparable. Another explanation can be that there is a greater institutional demand for VIX futures than there is for VSTOXX futures, however to confirm that I would need to separate the effects of risk premium from statistical effects that also produce upward-sloping futures curve. Accomplishing that would be anything but simple.

Leaving theoretical issues aside it appears that smart traders can take advantage of different futures slopes by rolling into the contracts with the cheapest cost of carry, possibly financing the trade with selling the expensive roll. For example consider an investor who is long a broad portfolio of US stocks and wants to hedge against volatility spike. Holding VXX or rolling VIX futures can be very expensive in the long run; doing the same thing with VSXX / VSTOXX futures may be cheaper, while providing a proxy for VIX in the time of volatility spikes.

Edit Dec 7, 2010: See my updated post on VSXX here.

Weekly market report

Wall st delivered a mixed bag of news with VIX, VNKY, and VSTOXX and their underlying markets almost unchanged. VXD - volatility index based...